1. Households’ financial wealth increased in 2009
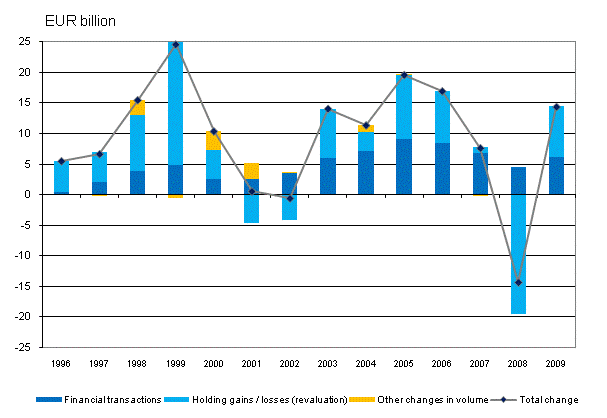
After the steep decline of the previous year, holding gains from investments in shares and funds turned households’ financial assets towards clear growth last year. The value of their financial assets grew by nearly EUR 15 billion. At the same time the focus of households’ investments shifted from deposits to shares and funds.
In 2009 investments brought households holding gains amounting to a total of EUR 8 billion. Gains from direct investments in shares totalled EUR 5 billion and those from investments in mutual funds EUR 1 billion. The holding gains only cover part of the EUR 19 billion holding losses which arose in the previous year. Last year, households acquired additional financial assets to the net amount of good EUR 6 billion, or EUR 2 billion more than in the year before.Figure 1. Change in financial assets of households

As the insecurity eased off on the stock markets, the focus of households’ acquisition of financial assets shifted from deposits to shares and funds. The flow of households’ money into deposits now only amounted to EUR 1 billion, whereas in the previous year the figure was EUR 8 billion. Households’ interest in quoted shares which had arisen in 2008 gained strength and households purchased them to the total net value of EUR 2 billion. EUR 2 billion were also invested in mutual fund shares. Due to the fallen interest rates, significant proportions of time deposits were transferred to current accounts.
All in all households’ financial assets amounted to EUR 201 billion at the end of 2009. Of this amount EUR 72 billion were deposits, EUR 23 billion quoted shares, EUR 39 billion other shares and equity, EUR 34 billion life and pension insurance reserves and EUR 13 billion mutual fund shares. The value of other financial assets held by households was EUR 20 billion.
Households’ financial position began to show surplus in 2009. The annual growth of debts slowed down to EUR 4 billion, but indebtedness ratio, i.e. proportion of loans relative to disposable income, rose to 112.4 per cent from 109.8 per cent where it stood in the previous year. Households’ net financial assets, i.e. difference between their financial assets and liabilities, grew by EUR 10 billion from 2008. At the end of 2009 they stood at EUR 88 billion.
1.1. Despite growing debt, government sector’s net financial assets increased
Examined through revenue and expenditure, the Finnish general government showed a large deficit last year. Nevertheless, its balance sheet position improved even though the fall in revenue and economic recovery measures were financed with new debts amounting to EUR 14 billion. Financial assets grew by EUR 26 billion, one-half of which came from investment holding gains of employment pension schemes. General government’s net financial assets thus went up by EUR 12 billion to EUR 107 billion. Central government’s holding gains from shares amounted to EUR 4 billion but heavy indebtedness put its net financial assets EUR 16 billion into the negative.
Employment pension schemes invested their surplus into shares and mutual fund shares in 2009. They also lent EUR 2 billion to non-financial corporations. After the exceptional year of 2008, the focus of investments turned back to the rest of the world.
1.2. Non-financial corporations’ loan payables turned to decline
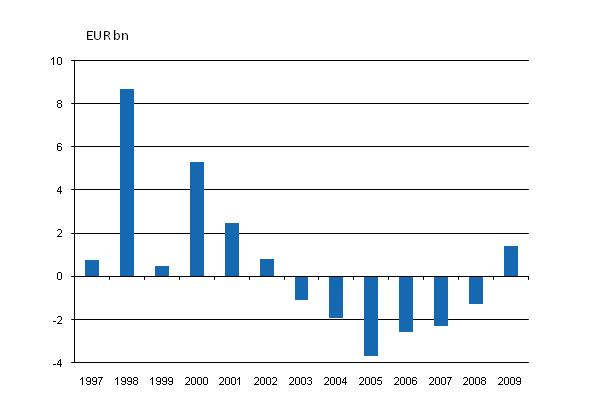
Non-financial corporations reduced their debts in 2009. Short-term loans were amortized to the total value of EUR 7 billion, bringing their amount back to the pre-2008 level. In addition, loans between non-financial corporations diminished significantly. By contrast, non-financial corporations issued bonds to the net value of almost EUR 4 billion as the capital market began to recover. Most of these were purchased by foreign investors. Non-financial corporations also acquired more financing than before through issuing new equity on the stock market. Quoted companies issued new shares to the net value of EUR 1.4 billion. From 2003 up to last year they had been reducing their equity liabilities by buying back more of their own shares than issuing new ones.Figure 2. Emissions of quoted shares by non-financial corporations, net

Emissions less buybacks of own shares
1.3. Strong investment in foreign shares
In 2009, Finnish investors’ money flowed strongly into foreign shares and mutual fund shares. Employment pension schemes, investment funds, financial and insurance corporations, and households purchased them to the total value of EUR 13 billion whereas in the previous year they repatriated EUR 3 billion of their money from them. However, non-financial corporations’ foreign direct equity investments in dried up and only EUR 1 billion was spent on them.
As in the year before, foreign investors cut back their holdings in Finnish quoted shares. In all, Finnish quoted shares were sold back to domestic investors to the net value of EUR 2 billion. At the end of the year the value of the foreign ownership of Finnish quoted shares was EUR 65 billion. The share of the foreign ownership of the value of Finnish quoted shares fell to just below 50 per cent from the 59 per cent it still was one year earlier. The share was the lowest since 1997.
1.4. Investment funds recovered
The outward flow of assets from domestic investment funds which began in 2008 halted and EUR 5 billion new money flowed into them last year. One-half of the investments came from abroad but the funds also attracted domestic households and insurance corporations. However, more money was withdrawn from than invested in money market funds. Over the year investment funds grew by a total of EUR 12 billion, of which holding gains from investments accounted for EUR 7 billion.
Source: Financial Accounts, Statistics Finland
Inquiries: Matti Okko +358-9-1734 3341, Marjatta Ropponen +358-9-1734 3323, rahoitus.tilinpito@stat.fi
Director in charge: Ari Tyrkkö
Updated 15.7.2010
Official Statistics of Finland (OSF):
Financial accounts [e-publication].
ISSN=1458-8145. 2009,
1. Households’ financial wealth increased in 2009
. Helsinki: Statistics Finland [referred: 19.2.2026].
Access method: http://stat.fi/til/rtp/2009/rtp_2009_2010-07-15_kat_001_en.html

