1. Households' financial assets and liabilities grew in 2010
As in the previous year, holding gains boosted households' financial wealth in 2010. Households received EUR 10 billion of holding gains from their investments in shares and mutual funds. In addition, households acquired further financial assets to the net amount of EUR 6 billion last year, which is around EUR 1.5 billion less than in 2009.
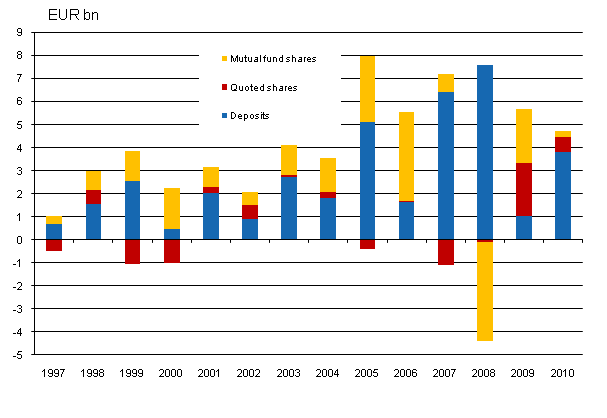
Figure 1. Households' net acquisition of deposits, quoted shares and mutual funds, EUR billion

In 2010, the focus in households' investments shifted from shares and mutual funds back to deposits. Deposits have typically been the most important investment target of households, but in 2009 households favoured quoted shares and mutual fund shares. Especially households' net investments in mutual funds remained low last year. Buoyed by the risen level of interest rates, a transition took place in deposits from cash deposits to term deposits.
Overall, households’ financial assets amounted to EUR 223 billion at the end of 2010. Of this amount, EUR 75 billion were deposits, EUR 44 billion unquoted shares and equity, EUR 44 billion insurance technical reserves, EUR 29 billion quoted shares and EUR 14 billion mutual fund shares. The value of other financial assets held by households was EUR 16 billion.
Households' debts also grew in 2010. Their loan debt increased by EUR 6 billion during 2010, reaching EUR 111 billion at the end of the year. Indebtedness rate, i.e. proportion of loans relative to disposable income, rose to 113.7 per cent from the previous year's 111.6 per cent. However, households' financial assets increased more than their debts, in consequence of which households' net wealth, i.e. difference between financial assets and liabilities, grew by EUR 10 billion from the previous year.
1.1.Government sector's balance sheet position improved
The government sector's balance sheet position improved in 2010. At the end of the year, the government sector's net financial assets amounted to EUR 116 billion, which was EUR 8 billion more than twelve months earlier. The increase in the net financial assets of general government came mainly from growth in the net financial assets of employment pension schemes. By contrast, the balance sheet position of central government weakened further.
The net financial assets of employment pension schemes grew by EUR 15 billion, rising to EUR 135 billion at the end of the year. The strong growth of the net financial assets of employment pension schemes is largely explained by the risen market values of the shares and equity held by them. Employment pension schemes' holding gains totalled EUR 12 billion and their net investments EUR 3 billion in 2010. Employment pension schemes invested the largest amounts of their assets in foreign mutual fund shares and in domestic and foreign quoted shares.
The weakening of the central government's balance sheet position, which started in 2008, continued. Over the year, the central government's net financial assets decreased by EUR 7 billion, falling to EUR -22 billion. The fall in the central government's net financial assets is due to indebtedness, as the central government also accrued holding gains. In 2010, the central government's debt increased by EUR 13 billion and its holding gains amounted to EUR 3 billion.
1.2. Fairly low emissions of quoted shares
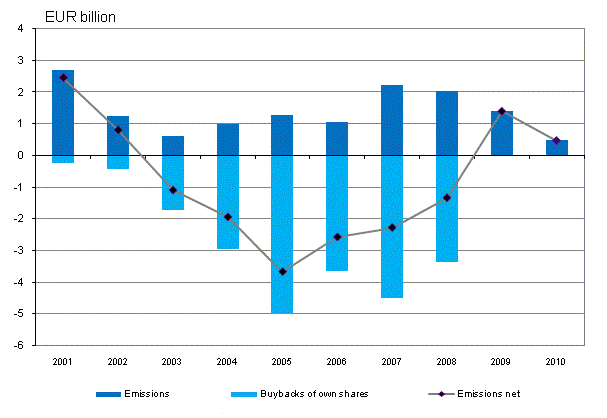
Non-financial corporations acquired financing by issuing new equity on the stock market in 2010. Quoted companies issued new shares to the value of EUR 0.5 billion but bought back hardly any own shares. From 2003 to 2008, non-financial corporations amortized their share debt by buying back more of their own shares than issuing them.Figure 2. Emissions of quoted shares, EUR billion

Non-financial corporations also increased their debt financing during the year. Debt financing refers to the total of loan debts and financing in the form of debt securities. Over the year, non-financial corporations’ loan debt grew by EUR 3 billion, rising to EUR 161 billion. In addition, non-financial corporations increased their debt by issuing bonds to the net amount of some EUR 2 billion.
1.3. Foreign bonds, shares and mutual funds were favoured
In 2010, Finnish investors’ money flowed into foreign bonds, shares and mutual fund shares. Domestic investors acquired these foreign financial instruments to the value of EUR 39 billion, whereas the year before the respective acquisitions amounted to EUR 30 billion. Foreign bonds were acquired to the total value of EUR 23 billion, and shares and mutual fund shares each to the value of EUR 8 billion. Foreign bonds were invested in especially by deposit banks, foreign unquoted shares by non-financial corporations, and foreign mutual fund shares and quoted shares by employment pension schemes.
As in earlier years, foreign investors cut back their holdings in Finnish quoted shares. In all, Finnish quoted shares were sold to domestic investors to the net value of EUR 2 billion. At the end of the year, the value of the foreign ownership of quoted shares was EUR 73 billion. The proportion of foreign ownership of the value of Finnish quoted shares fell to 35 per cent.
1.4. Money flowed into domestic investment funds
Some EUR 3 billion new money flowed into domestic investment funds last year. Thus, domestic investment funds interested investors less than in 2009 when the net amount invested in them was nearly EUR 6 billion. Slightly under one-half of the investments in investment funds came from abroad but the funds also interested insurance corporations. However, more money was withdrawn from than invested in money market funds. Over the year, investment funds grew by a total of EUR 9 billion, of which holding gains from investment portfolios made up EUR 6 billion.
Source: Financial Accounts, Statistics Finland
Inquiries: Saara Roine +358-9-1734 3325, rahoitus.tilinpito@stat.fi
Director in charge: Ari Tyrkkö
Updated 14.7.2011
Official Statistics of Finland (OSF):
Financial accounts [e-publication].
ISSN=1458-8145. 2010,
1. Households' financial assets and liabilities grew in 2010
. Helsinki: Statistics Finland [referred: 10.2.2026].
Access method: http://stat.fi/til/rtp/2010/rtp_2010_2011-07-14_kat_001_en.html

