Published: 6 October 2011
Production of electricity and heat grew in 2010
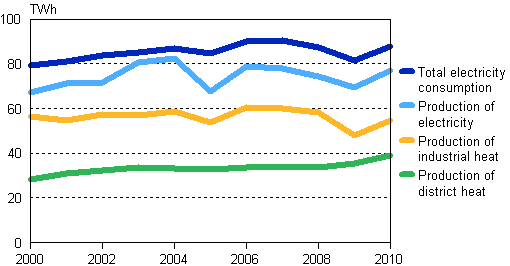
According to Statistics Finland's statistics on production of electricity and heat, domestic production of electricity grew by 12 per cent, production of district heat by nine per cent and that of industrial heat by 14 per cent in 2010. The eight per cent growth in total consumption of electricity from the previous year raised domestic production of electricity. In addition, more electricity was produced for the Nordic electricity markets than one year before. The production of electricity grew particularly in separate production of condensing power, by 58 per cent.
Production of electricity, district heat and industrial heat in 2000–2010

Total electricity consumption rose by eight per cent from the previous year, being 87.7 terawatt hours (TWh), or one billion kilowatt hours (kWh). Of this consumption, 88 per cent was covered by domestic production and the remaining 12 per cent by net imports of electricity. Electricity is imported to Finland from the Nordic countries, Russia and Estonia. Electricity is also exported from Finland to other Nordic countries and Estonia. The volume of imported electricity remained on level with the previous year, but exports of electricity grew to the Nordic countries, where, as in the previous year, the water reserves were at a lower level than average.
In Finland and other Nordic countries, the demand for electricity rose as the economy started to grow again after the downturn. According to Statistics Finland’s data on the volume index of industrial output, industrial output in Finland grew by six per cent in 2010. The cold winter and autumn also increased consumption of electricity.
In 2010, the volume of electricity produced in Finland amounted to 77.2 TWh. The production grew by 12 per cent. The production grew most for condensing power, up by 58 per cent. Of condensing power, 66 per cent was produced with coal (includes hard coal, coke, and blast furnace and coke oven gas). Electricity produced with combined heat and power production rose, by 13 per cent, thus reaching a new record, 28.1 TWh. The growth in combined heat and power production was due to the recovery of the forest industry and the introduction of new power plants.
The use of coal, wood and peat in electricity production increased. The production of hydro power grew by one per cent and that of nuclear power contracted by three per cent. The production of wind power went up by six per cent.
The use of coal, wood and peat in electricity production increased. The production of hydro power grew by one per cent and that of nuclear power contracted by three per cent. The production of wind power went up by six per cent.
The production of district heat grew by nine per cent from the previous year, to 39.0 TWh. The cold winter and autumn increased the need for heating, in addition to which the number of district heat customers continued to grow.
Nearly 60 per cent of district heat was produced from fossil fuels. One half of this was produced with natural gas. The volumes of district heat produced with peat and renewable fuels were almost equal, 19 per cent. The production of district heat grew particularly for natural gas, peat and wood fuels.
The production of industrial heat grew by 14 per cent, being 54.8 TWh. The recovery of industrial output increased the need for heat for the industry's own use, but also industrial enterprises' own energy production.
Over 60 per cent of the heat used by the industry was produced with renewable fuels. The majority of renewable fuels was covered by black liquor from the forest industry and the rest by other wood fuels. The use of recycled fuels was low in the production of industrial heat. Twenty-one per cent of heat was produced with fossil fuels. The biggest fossil fuel in the production of industrial heat was natural gas, 14 per cent. The production of industrial heat with wood fuels and peat went up. Nine per cent of heat was produced with peat.
Electricity and heat production by production mode in 2010
| Electricity, TWh | District heat, TWh | Industrial heat, TWh | Total fuels used, PJ 1) | |
| Separate production of electricity | ||||
| - Hydro power | 12,7 | – | – | – |
| - Wind power | 0,3 | – | – | – |
| - Nuclear power | 21,9 | – | – | – |
| - Condensing power 2) | 14,2 | – | – | 136,8 |
| - Total | 49,1 | – | – | 136,8 |
| Combined heat and power production | 28,1 | 29,2 | 46,6 | 450,9 |
| Separate heat production | – | 9,7 | 8,2 | 74,8 |
| Total production | 77,2 | 39,0 | 54,8 | 662,5 |
| Net imports of electricity | 10,5 | – | – | – |
| Total | 87,7 | 39,0 | 54,8 | 662,5 |
2) Condensing power includes condensing power plants, shares of condensing electricity of combined heat and power production plants, and peak gas turbines and similar separate electricity production plants.
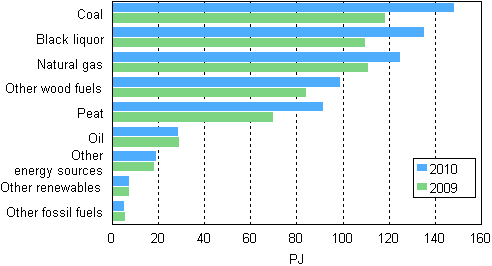
The use of fuels in the production of electricity and heat increased by 19 per cent in 2010. Slightly less than one half of fuel use was covered by fossil fuels, 22 per cent by coal and 19 per cent by natural gas. The use of renewable fuels accounted for 37 per cent, that of black liquor from the forestry industry for 20 per cent and that of other wood fuels for 15 per cent. The use of peat amounted to 14 per cent.
Compared with the previous year, the use of coal grew by 25 per cent, that of wood fuels by 21 per cent and that of peat by 31 per cent.
Use of fuels in electricity and heat production in 2009 and 2010

The statistics on production of electricity and heat cover the entire production of electricity. The statistics do not include small district heating plants or industrial enterprises.
Links:
Statistics Finland:
http://tilastokeskus.fi/keruu/ene/index_en.html
Finnish Energy Industries:
http://www.energia.fi/en/statistics-and-publications/electricity-statistics
Source: Statistics on production of electricity and heat, Statistics Finland and Electricity statistics, Finnish Energy Industries
Inquiries: Minna Niininen 09 1734 3549, energia@stat.fi
Director in charge: Leena Storgårds
Publication in pdf-format (342.4 kB)
- Tables
-
Tables in databases
Pick the data you need into tables, view the data as graphs, or download the data for your use.
Appendix tables
- Appendix table 1. Electricity and heat production by production mode and fuel in 2010 (6.10.2011)
- Appendix table 2. Fuel use in electricity and heat production, TJ (6.10.2011)
- Appendix table 3. Production and total consumption of electricity, GWh (6.10.2011)
- Appendix table 4. District heat production, GWh (6.10.2011)
- Appendix table 5. Industrial heat production, GWh (6.10.2011)
- Figures
-
- Appendix figure 1. Electricity production by energy sources 2010 (6.10.2011)
- Appendix figure 2. Electricity production by energy type 2000 - 2010 (6.10.2011)
- Appendix figure 3. Electricity production by production mode 2000 - 2010 (6.10.2011)
- Appendix figure 4. Electricity production with renewable energy sources 2000 - 2010 (6.10.2011)
- Appendix figure 5. Electricity production with renewable energy sources 2000 - 2010 (6.10.2011)
- Appendix figure 6. Heat production 2000 - 2010 (6.10.2011)
- Appendix figure 7. District heat production by fuels 2000 - 2010 (6.10.2011)
- Appendix figure 8. Industrial heat production by fuels 2000 - 2010 (6.10.2011)
- Appendix figure 9. Fuel use by production mode in electricity and heat production 2010 (6.10.2011)
- Appendix figure 10. Fuel use in electricity and heat production 2009 - 2010 (6.10.2011)
- Appendix figure 11. Fuel use in separate electricity production 2009 - 2010 (6.10.2011)
- Appendix figure 12. Fuel use in combined heat and power production 2009 - 2010 (6.10.2011)
- Appendix figure 13. Fuel use in separate heat production 2009 - 2010 (6.10.2011)
Updated 6.10.2011
Official Statistics of Finland (OSF):
Production of electricity and heat [e-publication].
ISSN=1798-5099. 2010. Helsinki: Statistics Finland [referred: 22.2.2026].
Access method: http://stat.fi/til/salatuo/2010/salatuo_2010_2011-10-06_tie_001_en.html

