

Electricity and heat production and fuels 2011
Production and consumption of electricity in decline
Total electricity consumption fell by four per cent from the previous year and amounted to 84.2 terawatt hours (TWh), or billion kilowatt hours (kWh). Of this consumption, 84 per cent was covered by domestic production and 16 per cent with net imports of electricity. Electricity is imported to Finland from the Nordic countries, Russia and Estonia. Electricity is also exported from Finland to other Nordic countries and Estonia. The net exports of electricity to the Nordic countries of the past few years turned into net imports in summer 2011. The availability of hydro power grew from the previous years in Sweden and Norway and the production of nuclear power also increased in Sweden. Relatively standard amounts of electricity have been imported from Russia in recent years but towards the end of 2011, the amount of electricity imported from Russia decreased due to the deregulation of the electricity market and risen prices. Net imports of electricity grew by 32 per cent from the previous year. Net imports are calculated by deducting exports from imports.Production of electricity, district heat and industrial heat in 2000 - 2011
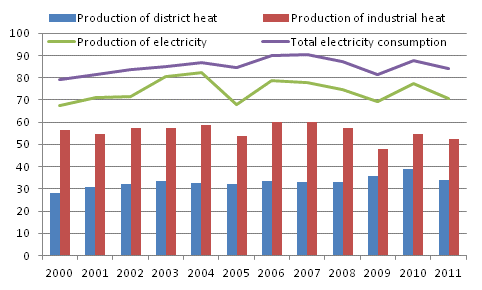
With regard to electricity consumption, the year divided into two. The cold weather in the early part of the year and high capacity utilisation rates in manufacturing kept the demand for electricity high. According to the Finnish Meteorological Institute, autumn 2011 was exceptionally mild, and the euro crisis slowed down and partly reversed growth in manufacturing. According to Statistics Finland’s Volume Index of Industrial Output, total industrial output grew by barely one per cent in Finland in 2011. Among the electricity-intensive industries, preliminary year-on-year change indicated decline for the forest industry. By contrast, the year-on-year changes of the indices for the chemical and metal industries showed growth from the previous year.
In 2011, the volume of electricity produced in Finland amounted to 70.4 TWh. Production decreased by nine per cent from the previous year. Separate production of electricity by condensing plants decreased by 31 per cent. The volume of the production of condensing electricity fluctuates according to the demand for electricity and the availability of hydro power in the Nordic countries. Nine per cent less electricity was produced with combined heat and power production and four per cent less with hydro power. The amount of electricity produced with nuclear power remained quite constant at 22 TWh in Finland. Thirty-two per cent of the electricity produced in Finland was produced with nuclear power in 2011, which was two per cent more than in the year before. The amount of wind power, in turn, grew to 0.481 TWh due to new wind power plants. The growth from the previous year was 64 per cent but the share of wind power of all electricity production is just under one per cent.
The amount of electricity produced with fossil fuels diminished by one-quarter. Electricity produced with coal declined most, by 33 per cent. The share of electricity produced with fossil fuels fell to 27 per cent. Electricity produced with peat accounted for seven per cent of electricity production. Thirty-three per cent of the electricity produced in Finland was produced with renewable energy sources. Around one-half of this was produced with hydro power and almost all of the remainder with wood. Wood, or wood-based fuels comprise wood fuels, so-called black liquor from the forest industry that originates from the processes of the pulp industry, and other wood-based fuels such as odour gases from of paper and forest industries. Seven per cent of electricity was produced with both black liquor and with other wood fuels, i.e. 14 per cent in all.Electricity production by energy source 2000–2011
Mild autumn reduced demand for district heat
Production of district heat amounted to 34.0 TWh in 2011. Production decreased by 13 per cent from the previous year. As in the previous year, the need for space heating energy was high due to the cold early part of the year. In 2011, the consumption of district heat diminished from the previous year as, in deviation from the previous year, the autumn was exceptionally mild according to the Finnish Meteorological Institute. In 2010, the demand for district heat was record high, for the autumn was also cold.
Fifty-five per cent of district heat was produced with fossil fuels. One-half of this was produced with natural gas. District heat produced with peat accounted for 18 per cent of total production. The amounts of district heat produced with fossil fuels and peat diminished by more than average; by 18 per cent each. The share of district heat produced with renewable fuels rose to 23 per cent. The change from the year before was three per cent. Less district heat was produced especially with oil, natural gas and peat.
District heat production 2000-2011
Heat production 2000-2011
Industrial trends decreased demand for industrial heat
Production of industrial heat amounted to 56.2 TWh in 2011. Production decreased by four per cent from the previous year. As in the previous years, the use of industrial heat remained below normal although at the beginning of the year industrial trends indicated that the recovery of the year before would continue. Towards the end of the year, industrial growth slowed down and turned to decline in the forest industry where processes exploit heat intensively.
Over 60 per cent of the heat used by industry was produced with renewable fuels. The majority of renewable fuels was covered with black liquor from the forest industry - 45 per cent of the total in 2011 - and the rest with other wood fuels. Nineteen per cent of the heat was produced with fossil fuels. The main fossil fuel in the production of industrial heat was natural gas, which accounted for 11 per cent of the total. Nine per cent of the heat was produced with peat.
Industrial heat production 2000-2011
Black liquor from the forest industry became the main fuel while use of other fuels diminished
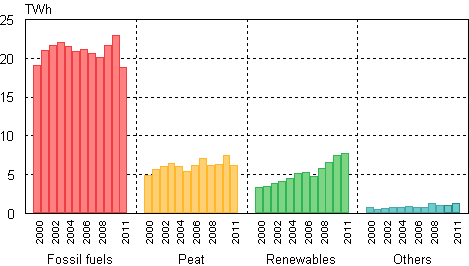
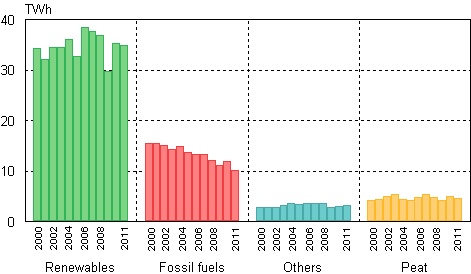
The use of fuels in the production of electricity and heat decreased by 10 per cent in 2011. Renewable fuels rose above fossil fuels in fuel use. Of the used fuels, 42 per cent were renewable fuels, 41 per cent fossil fuels and 14 per cent peat. The use of renewable fuels increased by only three per cent from the previous year but the use of fossil fuels decreased by 21 per cent and the use of peat by 12 per cent.
This examination of fuels excludes so-called non-fuel modes of energy production, i.e. hydro and wind power. Nuclear power is also not regarded as equal with fuels in this examination. According to the international statistical convention, the efficiency ratio of nuclear power is assumes to be 33 per cent, i.e. three-fold amount compared to the produced electricity is counted as primary energy.
The use of black liquor from the forest industry remained almost unchanged although according to the Volume Index of Industrial Output the moving year-on-year change in the forest industry’s output was -3.8 per cent. The use of coal and natural gas decreased, that of coal outright plummeted. The use of peat diminished as the production of peat decreased from the previous years. A summer season that is ideal for peat production includes long rainless periods. Although summer 2011 was sunny and warm, rains were plentiful and came at regular intervals. The decreased amount of peat was compensated with the use of wood fuels.
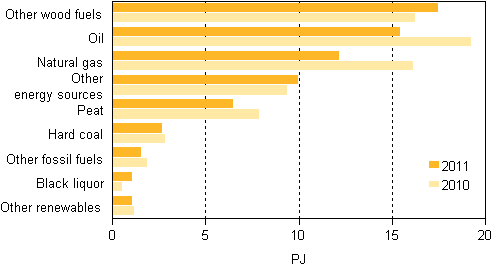
Use of fuels in electricity and heat production 2010-2011
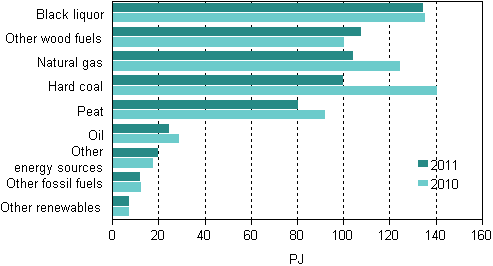
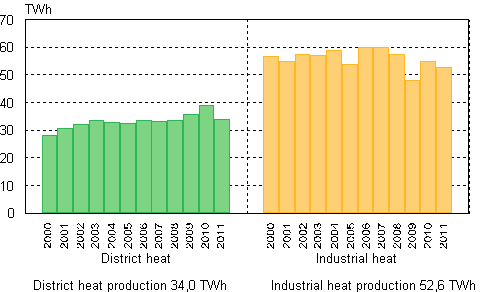
The use of fuels in separate production of electricity means the use of fuels in the production of condensing power. Other separate production of electricity is regarded as being so-called non-fuel. The amount of produced condensing power decreased by nine per cent but the volume of fuel used for condensing power decreased by 27 per cent. The difference is explained by the efficiency ratio of production, i.e. the ratio between produced electricity and used amount of fuel. The efficiency ratio of condensing power typically varies from 35 to 40 per cent, while around 75 to 80 per cent of fuel energy can be utilised in combined heat and power production and some 80 to 90 per cent in separate heat and power production.
Sixty per cent of the fuels used in condensing power production were fossil fuels. The share of peat was good one-fifth. The use of coal, the most important fossil fuel, diminished by 44 per cent. The use of peat diminished. By contrast, the use of other wood fuels increased. As the use of fossil fuels and peat diminished the share of renewable fuels rose to 20 per cent.
Use of fuels in separate electricity production 2010-2011
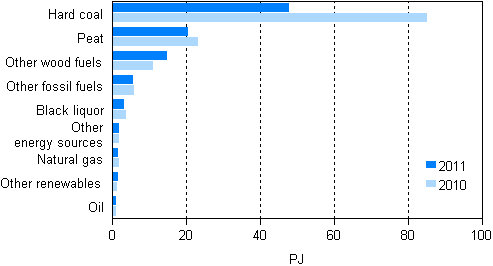
No major changes took place in the use of fuels in combined heat and power production. The main changes were reductions in the use of natural gas and peat. As the use of fossil fuels and peat diminished the share of renewable fuels rose to 50 per cent.
Use of fuels in combined heat and power production 2010-2011
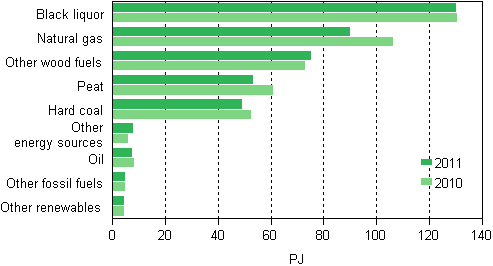
The use of oil in separate heat production decreased by 20 per cent, making "other wood fuels" the largest fuel category. The use of fossil fuels decreased by 21 per cent and the use of peat by 18 per cent.
Use of fuels in separate heat production 2010-2011
Source: Statistics on production of electricity and heat, Statistics Finland and Electricity statistics, Finnish Energy Industries
Inquiries: Minna Niininen 09 1734 3549, energia@stat.fi
Director in charge: Leena Storgĺrds
Updated 18.10.2012
Official Statistics of Finland (OSF):
Production of electricity and heat [e-publication].
ISSN=1798-5099. 2011,
Electricity and heat production and fuels 2011
. Helsinki: Statistics Finland [referred: 16.7.2026].
Access method: http://stat.fi/til/salatuo/2011/salatuo_2011_2012-10-16_kat_001_en.html