Published: 8 May 2020
Number of marriages contracted decreased further
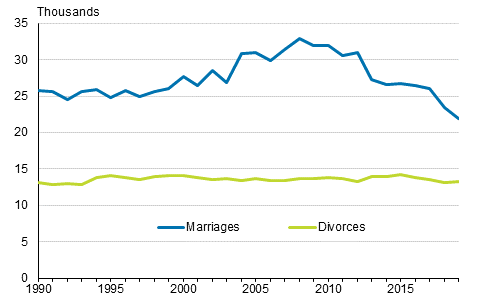
According to Statistics Finland’s data on population changes, 22,296 marriages were contracted in 2019, the number in 2018 was 23,799. The number of marriages entered into decreased by 1,503 in a year, which is, however, clearly lower than the previous year's 2,743. A total of 21,920 marriages between opposite-sex couples were entered into, which is 1,492 fewer than in the year before. Same-sex partners entered into 376 marriages, in the previous year the number was 11 higher.
The statistical method for calculating the total number of annually contracted marriages and divorces was changed starting from the statistics for 2017 so that the statistics include all marriages and divorces where at least one of the spouses resides permanently in Finland on the day of the event. In 1980 to 2016, the total number consisted of cases where the woman was permanently residing in Finland on the day of marriage or divorce. In the figure and table 121e the number of contracted marriages and divorces is presented with the revised statistical method retrospectively starting from 1990. In order for the numbers for different years to be comparable, the figures for 2017 to 2019 do not include same-sex marriages, which numbered 554, 387 and 376 in the above-mentioned years, or divorces, which amounted to 2, 29 and 54.
Number of marriages and divorces 1990–2019, opposite-sex couples

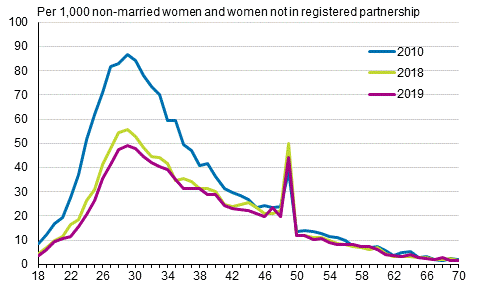
The marriage rate of opposite-sex couples, i.e. the ratio of persons who have entered into marriage of those who could marry, has decreased nearly continuously since 2008. In 2019, the decrease in the marriage rate of women and men continued. The decrease in the marriage rate was in relative terms slightly higher for women than in the year before. For men it was slightly lower than in the year before. Women’s marriage rate decreased by nine per cent and men’s by seven per cent. Women’s marriage rate decreased from 16 to 15 per one thousand women not married or not in a registered partnership from 2018 to 2019. The corresponding figure for men diminished from 17 to 16.
In 2019, the marriage rate decreased further in almost all age groups (Appendix figure 2, men’s marriage rate).
Marriage rate by age of woman 2010, 2018 and 2019, opposite-sex couples

Age at the time of first marriage turned upwards
In 2019, the average age of women and men entering into their first marriage rose for opposite-sex couples. The average age of women was 32.1 years, in the previous year 31.7, and correspondingly that of men 34.2 years, in the previous year 33.9. The average age of women entering into their second marriage was 45.1 years and it rose by four tenths from 2018. The corresponding average age of men was 48.0 years and it rose by five tenths in one year.
In 2019, the average age in marriages between two women was 35.8 years, one year earlier it was 35.4. Correspondingly, the average age in marriages between two men was 41.7 years, having been one-tenth higher in 2018.
Around one in four got remarried
For women, the number of remarriages decreased less in relative terms than the number of first marriages. For men, the number of remarried persons increased slightly from the previous year. It follows that the share of first marriages in all marriages entered into decreased by one percentage point for women and slightly less for men. For both women and men, the share of first marriages in all marriages entered into decreased to 74 per cent.
Twenty-one per cent of all marriages contracted by women were second marriages, and five per cent were third marriages. Correspondingly, 22 per cent of all marriages contracted by men were second marriages and slightly under five per cent were third marriages.
August the most popular month for marriage in 2019
The most popular month for entering into marriage in 2019 was August, when 3,728 couples entered into marriage. July was the second most popular with 3,281 couples. In the 2010s, July and August have alternated as the most popular month of marriage. Because weddings usually take place on weekends, the change in “top position” is influenced by the annual variation in the number of weekends per month.
The number of marriages entered into was highest on 10 August, when 524 couples were married. The second most marriages were entered into on 3 August, 501 couples, and the third most on 27 July, 491 couples.
Number of divorces increased
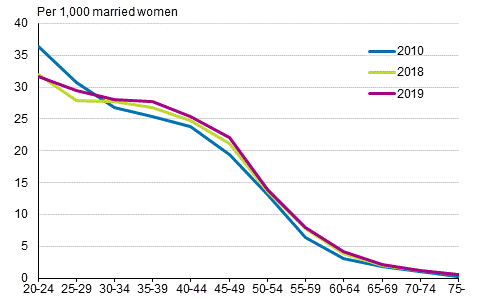
In 2019, a total of 13,365 marriages ended in divorce. Except for 54 of them, all were divorces where the spouses were of opposite sexes. The number of divorces between spouses of opposite sexes increased by 195 from the previous year. The annual number of divorces has fluctuated without a clear direction. The year 2019 ended a period of three consecutive years when the number of divorces had decreased. The annual changes in the numbers have, however, been so small that the divorce rate, i.e. the number of divorces in relation to married persons, has remained at the same level for over 20 years: 13 to 14 divorces per one thousand married women or men.
The divorce rate grew for women in nearly all age groups compared with the previous year. For men, the divorce rate decreased for those aged 30 and under but increased for those aged 35 to 59 (Appendix figure 3).
Divorce rate by age of woman 2010, 2018 and 2019, opposite-sex couples

In first marriages between opposite-sex spouses, the average age for women at the time of divorce was 41.1 years. The corresponding average age of men was 43.4 in 2019. The average age of women at the time of divorce rose from the year before by three tenths, that of men by four tenths. A slight upward trend has been visible in the average age at the time of divorce for both sexes in recent years.
More female couples were married than in the previous year, fewer male couples
In 2019, same-sex partners entered into 376 marriages of which 113 were between two men and 263 between two women. The number decreased only slightly from the previous year when 387 marriages were contracted. Women entered into 21 marriages more than in the previous year, men into 32 fewer. Because the number of marriages entered into by women grew more than that of men decreased, the total number fell only by 11.
In low figures, a small change in numbers may be considerable in relative terms. The fall by 32 in the number of marriages entered into by two men means a decrease of 22 per cent in relative terms. Correspondingly, the increase by 21 in the number of marriages entered into by two women means an increase of just under nine per cent. The number of marriages entered into by two men in 2019 is 44 per cent and that of marriages by two women 32 per cent lower compared to year 2017, when, by amending the Marriage Act, same-sex persons enter into marriage instead of registering a same-sex partnership.
The number of same-sex partnerships ending in divorce in 2015 to 2017 was close to 130. After that, the number of divorces has decreased and in 2019 there were 72 of them. In order to gain a better understanding of the total number of divorces of same-sex couples, divorces of married same-sex couples, 54, must be added to the figure above. Then the number, 126, is at the same level as divorces of only registered couples in previous years.
Twenty-seven of same-sex partnerships that ended in divorce were between men and 45 between women. Correspondingly, 12 of same-sex marriages ending in divorce were between men and 42 between women.
Changes in marital status, mean age of men and women at first marriage in 2010–2019
| Year | ||||||||||
| 2010 | 2011 | 2012 | 2013 | 2014 | 2015 | 2016 | 2017 | 2018 | 2019 | |
| Contracted marriages | 31 925 | 30 557 | 31 008 | 27 238 | 26 551 | 26 735 | 26 503 | 26 542 | 23 799 | 22 296 |
| Divorces | 13807 | 13 681 | 13 251 | 13 989 | 13 915 | 14 170 | 13 775 | 13 485 | 13 145 | 13 365 |
| Mean age at first marriage, opposite-sex couples, women | 30,3 | 30,6 | 30,8 | 30,6 | 30,7 | 31,2 | 31,4 | 31,7 | 31,7 | 32,1 |
| Mean age at first marriage, opposite-sex couples, men | 32,6 | 32,9 | 33,1 | 32,8 | 32,9 | 33,4 | 33,7 | 33,9 | 33,9 | 34,2 |
| Mean age at first divorce, opposite–sex couples, women | 39,9 | 40,4 | 40,0 | 40,0 | 39,9 | 40,4 | 40,5 | 40,6 | 40,8 | 41,1 |
| Mean age at first divorce, opposite-sex couples, men | 42,3 | 42,7 | 42,3 | 42,3 | 42,3 | 42,8 | 42,8 | 42,9 | 43,0 | 43,4 |
| 1) Divorces, same-sex couples and divorces from registered partnerships | 64 | 85 | 103 | 101 | 109 | 133 | 127 | 133 | 132 | 126 |
Source: Changes in marital status 2019. Statistics Finland
Inquiries: Timo Nikander 029 551 3250, info@stat.fi
Director in charge: Jari Tarkoma
Publication in pdf-format (299.9 kB)
- Tables
-
Tables in databases
Pick the data you need into tables, view the data as graphs, or download the data for your use.
- Figures
-
- Appendix figure 1. Average age of women by first marriage and first live birth 1982 - 2019 (8.5.2020)
- Appendix figure 2. Marriage rate by age of man 2010, 2018 and 2019, opposite-sex couples (8.5.2020)
- Appendix figure 3. Divorce rate by age of man 2010, 2018 and 2019, opposite-sex couples (8.5.2020)
- Quality descriptions
Updated 8.5.2020
Official Statistics of Finland (OSF):
Changes in marital status [e-publication].
ISSN=1797-643X. 2019. Helsinki: Statistics Finland [referred: 16.2.2026].
Access method: http://stat.fi/til/ssaaty/2019/ssaaty_2019_2020-05-08_tie_001_en.html

