Published: 5 November 2008
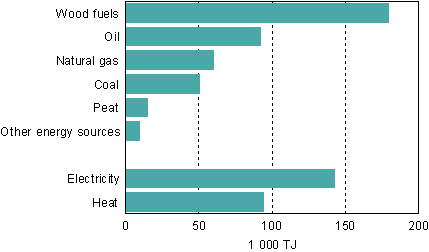
Wood fuels are the most significant energy source in manufacturing
According to Statistics Finland data, energy use in manufacturing was 650 petajoule (PJ) in 2007 (confidence interval of the statistics is ± 1.1 per cent). Wood fuels were the most used source of energy in manufacturing. Of all the industries, the forest industry used the most energy. It accounted for almost 57 per cent of the total energy used in all manufacturing. Examined by region, manufacturing used the most energy in South Karelia, North Ostrobothnia and Itä-Uusimaa.
Of all the fuels used in manufacturing, the most used were wood, oil, natural gas and coal. The use of electricity and heat is calculated in total use of energy as net purchases. This means that the amount of energy sold or delivered from the establishment is deducted from the amount of energy purchased or received.
Use of energy sources in manufacturing 2007

The Region of South Karelia accounted for almost 13 per cent of the energy used in all manufacturing. Energy use in manufacturing was also high in North Ostrobothnia, Itä-Uusimaa (both 12 per cent) and Kymenlaakso (9 per cent). Of the regions, Etelä-Savo, South Ostrobothnia and Åland used the least energy.
In 2007 the forest industry accounted for almost 59 per cent of the total use of electricity in manufacturing. Of the regions, the manufacturing establishments of Kymenlaakso and South Karelia used the most electricity. Each of these two regions accounted for over 10 per cent of the total electricity used in manufacturing.
Total consumption of electricity in manufacturing
| 1 000 GWh | confidence interval, ± % | |
| Forest industry | 28 218,4 | 0,7 |
| Chemical industry | 6 695,3 | 3,4 |
| Manufacture of basic metals | 5 736,5 | 1,4 |
| Machinery and metal manufacturing | 2 315,5 | 9,7 |
| Other manufacturing | 1 877,1 | 14,0 |
| Food industry | 1 624,1 | 9,5 |
| Mining and quarrying | 770,9 | 17,5 |
| Manufacture of electrical and optical equipment | 703,3 | 18,5 |
| Manufacture of textiles and wearing apparel | 234,4 | 15,2 |
| Total | 48 175,5 | 1,1 |
The 2007 statistics are based on the revised inquiry on energy use in manufacturing. The data were collected with an annual inquiry from establishments in the industries Mining and quarrying (C) and Manufacturing (D) as well as the power plants belonging closely to the activities of these establishments. The industry Electricity, gas and water supply (E) is not included in the inquiry. The data for 2007 were collected from a sample consisting of some 2,900 establishments. The data are published by energy source, industry and region.
Source: Statistics Finland, Business Structures
Inquiries: Ms Kirsi-Marja Aalto +358 9 1734 3442, energia@stat.fi
Acting Director in charge: Mr Matti Parkkinen
- Tables
-
Appendix tables
- Figures
-
- Figure 1. Use of energy sources in manufacturing 2007 (5.11.2008)
- Figure 2. Energy use in manufacturing by energy source 2007 (5.11.2008)
- Figure 3. Energy use in manufacturing by industry 2007 (5.11.2008)
- Figure 4. Energy use in manufacturing by region 2007 (5.11.2008)
- Figure 5. Total electricity consumption in manufacturing 2007 (5.11.2008)
- Figure 6. Total electricity consumption by manufacturing branch 2007 (5.11.2008)
- Figure 7. Total electricity consumption in manufacturing by region 2007 (5.11.2008)
Last updated 4.11.2008
Official Statistics of Finland (OSF):
Teollisuuden energiankäyttö [e-publication].
ISSN=1798-775X. 2007. Helsinki: Tilastokeskus [referred: 23.2.2026].
Access method: http://stat.fi/til/tene/2007/tene_2007_2008-11-05_tie_001_en.html

