This set of statistics has been discontinued.
Statistical data on this topic are published in connection with another set of statistics.
Data published after 5 April 2022 can be found on the renewed website.
Published: 22 December 2009
Decrease in top incomes contracted income differentials
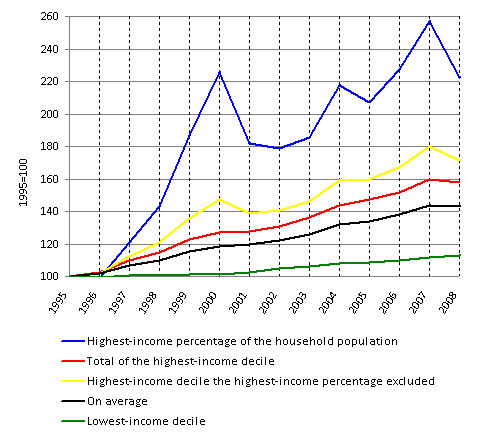
In 2008, the average disposable money income of households fell by 0.3 per cent in real terms from the previous year. However, measured with median income, the income grew by another 1.5 per cent as Statistics Finland’s Total statistics on income distribution show. In 2008, the income differentials between different population groups also narrowed down clearly from the previous year’s record level. This is because the development in the income of the highest-earning population group was clearly weaker than that of other population groups.
In the highest-income decile of the population average income fell by 4.8 per cent. In the highest-earning percentage of the population income decreased by clearly more, that is, by 13.3 per cent. By contrast, in other deciles household income went up in 2008. In the lowest-income decile income growth in real terms was 1.3. per cent.
Figure 1. Development in households’ average real income in 1995-2008. Concept of income: disposable money income per consumption unit. 1995=100

However, in a longer term, the income of high-income groups has gone up clearly more strongly than that of low-income groups. The income of households in the lowest-income decile was only 13 per cent higher in real terms in 2008 than in 1995. The respective rise in the highest-income decile was good 70 per cent. In the highest-income percentage of the household population, the increase in income exceeded 120 per cent. The real change in the total average income of the population amounted to about 43 per cent in the 1995 to 2008 period.
Households' income development was fastest in Luhanka and weakest in Kustavi
Income comparisons by municipality are made in relation to median income as it describes the income of the average population more reliably than mean income. Measured with median income, increase in income was fastest in the municipality of Luhanka in North Ostrobothnia where median household income was 8 per cent higher in real terms in 2008 than one year previously. Rise in income exceeded seven per cent in the municipality of Ristijärvi in Kainuu and in the municipality of Sottunga in Åland. In the City of Helsinki, the country’s biggest municipality in terms of population, household income increased by 1.5 per cent.
Income development was weakest in the municipality of Kustavi in Varsinais-Suomi where median household income fell by 2.5 per cent in real terms in 2008. In the municipality of Kiikoinen in Satakunta household income decreased by 2.2 per cent while in the municipality of Humppila in Pirkanmaa it was 1.9 per cent down. In 2008, household income went down in real terms in a total of 35 municipalities year-on-year.
An examination stretching over a longer period of time reveals that median household income was good 36 per cent higher in 2008 than in the mid-1990s. Income has grown most in the municipality of Geta in Åland where household income was 58 per cent higher in real terms in 2008 than in 1995. Income growth in real terms has been slowest in the households of Hyrynsalmi in Kainuu where the growth of median income did not reach 20 per cent in the 1995- 2008 time period.
Source: Total statistics on income distribution, Statistics Finland
Inquiries: Pekka Ruotsalainen (09) 1734 2610
Director in charge: Riitta Harala
- Tables
-
Tables in databases
Pick the data you need into tables, view the data as graphs, or download the data for your use.
Updated 22.12.2009
Official Statistics of Finland (OSF):
Total statistics on income distribution [e-publication].
2008. Helsinki: Statistics Finland [referred: 16.2.2026].
Access method: http://stat.fi/til/tjkt/2008/tjkt_2008_2009-12-22_tie_001_en.html

