Published: 11 March 2020
Household-dwelling units’ income increased most in Helsinki
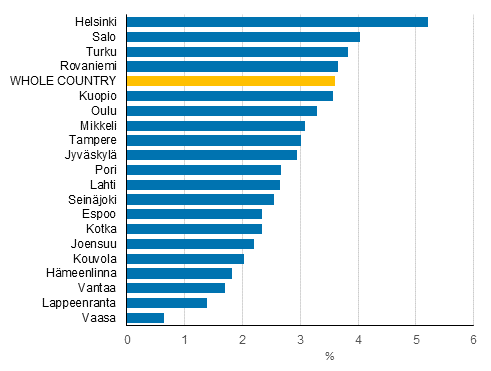
The income development of household-dwelling units has in recent years been more favourable than average in Helsinki according to the area data of Statistics Finland's income distribution statistics. The median income of household-dwelling units in Helsinki was in 2018 over five per cent higher than in 2014, when the modest income development stage that had continued for many years ended. Over the same time period the income of household-dwelling units in Salo grew by four per cent. The real growth of household-dwelling units’ income exceeded the threshold of 3.5 per cent in Turku, Rovaniemi and Kuopio. In the whole country, household-dwelling units' median income was in real terms 3.6 per cent higher in 2018 than in 2014.
Changes (%) in real income of household-dwelling units in 2014 to 2018, 20 municipalities with the largest population

Income concept equivalent disposable monetary income (incl. sales profits) per household-dwelling unit, median. Equivalent income = the household-dwelling unit's income divided by its consumption unit figure. Source: Income distrubution statistics' total data
Of large towns (20 municipalities with the largest population in 2018), income development was weakest in Vaasa, where household-dwelling units’ real income measured by the median was in 2018 nearly one per cent higher than four years earlier in 2014. In Lappeenranta, Vantaa and Hämeenlinna the income development of household-dwelling units was under two per cent in 2014 to 2018.
With regard to all municipalities, income development has been best for the household-dwelling units of the small municipality of Kumlinge in Åland, where median income was good 12 per cent higher in 2018 than in 2014. Growth figures of over 10 per cent were also reached in Lumijoki near Oulu and in Karijoki in South Ostrobothnia.
Income development has been most modest in Brändö and Eckerö in Åland, and in Merijärvi in North Ostrobothnia and in Kannus in Central Ostrobothnia, where household-dwelling units’ real income lowered somewhat in 2014 to 2018.
Household-dwelling units’ income development continued moderate in 2018
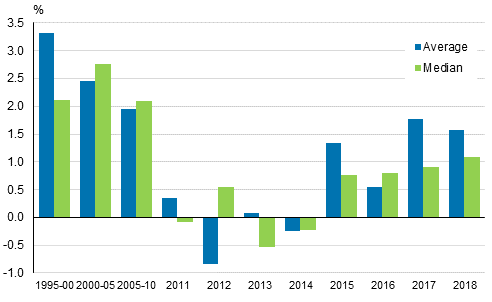
In the early 2010s, household-dwelling units’ income development was long modest, in some years household-dwelling units’ income even decreased in real terms. In the middle of the decade, income development turned clearly positive after a long time, income growth has continued moderate for four years.
In particular, according to the median that best describes the income of average household-dwelling units, income development has been good in recent years when compared to the early years of the decade. In contrast, there is still a long way to go to the growth figures of the late 1990s and early 2000s.
The real income of household dwelling-units grew in 2018 measured by the mean by 1.6 per cent from the previous year. According to the median income that best describes the income of average household-dwelling units, the real growth in household-dwelling units’ income was 1.1 per cent over the same period, which is a couple of tenths of a per cent more than one year earlier.
Annual changes in household dwelling-units’ real income in 1995 to 2018

Change in 1995 to 2000, 2000 to 2005 and 2005 to 2010 describes the average annual change in the period. Income concept: equivalent disposable monetary income (excl. sales profits) per household-dwelling unit. Equivalent income = the household-dwelling unit's income divided by its consumption unit figure. Source: Income distrubution statistics' total data
Source: Income distribution statistics, Statistics Finland
Inquiries: Pekka Ruotsalainen 029 551 2610
Director in charge: Jari Tarkoma
- Tables
-
Tables in databases
Pick the data you need into tables, view the data as graphs, or download the data for your use.
Updated 11.03.2020
Official Statistics of Finland (OSF):
Income distribution statistics [e-publication].
ISSN=1799-1331. Income differentials between population subgroups 2018. Helsinki: Statistics Finland [referred: 19.2.2026].
Access method: http://stat.fi/til/tjt/2018/02/tjt_2018_02_2020-03-11_tie_002_en.html

