Published: 13 December 2019
IT services explain growth in international trade in services in the third quarter of 2019
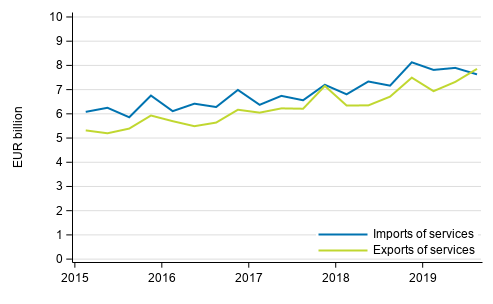
Service exports grew by 17 per cent in the third quarter of 2019 compared to the corresponding quarter last year. Service imports grew by five per cent. Service exports were especially boosted by an increase in the export of ICT services. Correspondingly, in imports, the biggest growth measured in euros came from other business services, while measured in relative terms, financial services grew most. Growth in imports was also supported by ICT services. The data appear from Statistics Finland's statistics on international trade in goods and services, which are part of balance of payments .
Figure 1. Imports and exports of services quarterly

The combined exports of goods and services grew by five per cent and imports by one per cent in the third quarter of 2019 compared with the corresponding quarter in 2018. Goods exports in balance of payments terms remained at last year’s level, but goods imports contracted by one per cent.
Growth in exports rested on ICT services
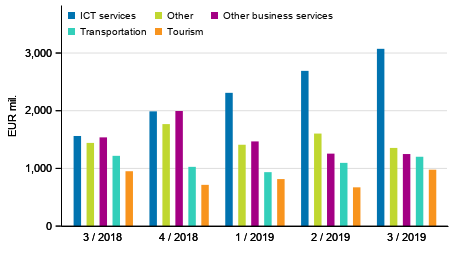
The growth in service exports is explained by increased exports of ICT services: The export of ICT services increased by EUR 1.5 billion over the year while the total volume of exports in international trade in services was EUR 7.9 billion. If ICT services are excluded, the change in service exports compared to the corresponding quarter in 2018 is actually negative. Decrease in service exports compared to the quarter one year ago occurred, in particular, in payments received for intellectual property products and in other business services. For other service items, the changes in exports were moderate.
Figure 2. Exports of services by service item

Exports to Asia growing briskly, trade with Sweden slowing down
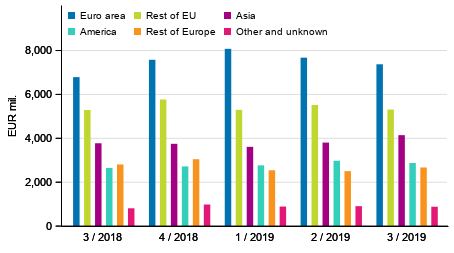
Nearly two-thirds of service exports were directed at Europe and one-half at EU countries. The share of Europe in total service exports has, however, decreased by three percentage points from 2018. Asian exports increased by 30 per cent from the corresponding quarter of last year. Exports to Asia cover 22 per cent of total exports
When examining the growth components of service exports the importance of Asia is emphasised: only slightly under one-half of the good EUR one billion growth in exports came from growth in European exports, while good one-third is explained by growth in Asian exports. For example, exports to China grew by EUR 170 million or 42 per cent from the respective quarter in the year before
Exports to Great Britain growing
Service exports to Great Britain went up by 21 per cent from the corresponding quarter of the year before. The share of Great Britain in total service exports has remained at four per cent as in 2018. Service imports from Great Britain has not changed from one year ago.
Balance of services turned into surplus
Statistics Finland has published statistics on international trade in services since 2015. Even though the balance of goods has fluctuated between being in surplus and deficit, the balance of services has been in deficit from one quarter to another. However, in the third quarter of 2019 the balance of services turned positive to around EUR 200 million.
Within the service items, most surplus was found in ICT services, where exports amounted to EUR 3.1 billion and imports to EUR 0.9 billion. Thus, the surplus was around EUR 2.2 billion. The surplus has grown clearly this year as one year ago the surplus of ICT services was good EUR 700 million. The change is explained by strong growth in the exports of ICT services. In addition, the balance of payments received for intellectual property products is good EUR 400 million in surplus. Other business services show the highest deficit (EUR 1.4 billion). In this item, the deficit has more than doubled compared to the corresponding quarter last year. The deficit increased due to both the imports of other business services increasing by one-fifth and the exports decreasing by one-fifth. The deficits in tourism and transport services were more moderate.
Figure 3. Exports of goods and services in balance of payments terms by area

Statistics on international trade
The statistics on international trade in goods and services are part of balance of payments . The statistics comprise breakdowns of goods and services on a more detailed level. The guidelines and recommendations of the Balance of Payments Manual (BPM6) applied to balance of payments are consistent with the European System of Accounts (ESA 2010). National Accounts are published on quarterly and annual levels . Finnish Customs publishes data on goods trade across borders. Goods trade published by Finnish Customs is used as source data for the statistics on international trade in goods and services. Removals and additions caused by definitions are made to them to achieve goods trade in balance of payments terms.
Finnish Customs’ statistical service, tilastot@tulli.fi, +358 29 552 335.
Source: International trade in goods and services 2018, Statistics Finland
Inquiries: Tommi Kaatrasalo 029 551 3320, Miia Korhonen 029 551 3420, Risto Sippola 029 551 3383, globalisaatio.tilastot@stat.fi
Publication in pdf-format (268.6 kB)
- Tables
-
Tables in databases
Pick the data you need into tables, view the data as graphs, or download the data for your use.
Appendix tables
- Revisions in these statistics
-
- Revisions in these statistics (13.12.2019)
Updated 13.12.2019
Official Statistics of Finland (OSF):
International trade in goods and services [e-publication].
ISSN=2343-4244. 3rd quarter 2019. Helsinki: Statistics Finland [referred: 17.2.2026].
Access method: http://stat.fi/til/tpulk/2019/03/tpulk_2019_03_2019-12-13_tie_001_en.html

