Wage and salary earners’ accidents at work
The risk of fatal accidents at work fell clearly
A total of 37 fatal accidents at work occurred to wage and salary earners in 2007. The number of fatal accidents at work fell clearly from the year before, as in 2006 accidents at work resulted in the death of 47 wage and salary earners. It should be noted that accidents in work traffic cannot always be separated from commuting accidents when settling claims. Therefore, some of the accidents that occur in work traffic are recorded as commuting accidents. The number of accidents at work in traffic has decreased from the early 1990s. (Appendix Table 1)
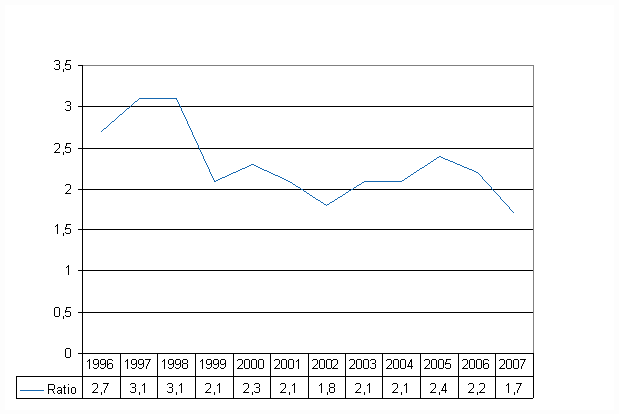
The risk of fatal accidents at work fell clearly as well. In 2007 an average of 1.7 per 100,000 wage and salary earners died in an accident at work (Figure 1). The respective figure was 2.2 in 2006. The difference between genders with regard to fatal accidents at work is still clear: of the 37 fatal accidents at work 32 occurred to men and only five to women. Fatal accidents at work took place in certain industries: almost two thirds occurred either in the industries of manufacturing, construction, or transport, storage and communication (Appendix Table 4). The risk of deaths at work has been particularly high in the construction industry. However, the risk declined from 2006, since in 2007 there were 5.9 fatal accidents per 100,000 wage and salary earners in construction. One year earlier this accident incidence rate was 7.3. The risk of fatal accidents at work also decreased in the industry of transport, storage and communication, where an average of 5.2 fatal accidents occurred per 100,000 wage and salary earners. In 2006 this accident incidence rate was 8.1.
Figure 1. Wage and salary earners’ fatal accidents at work per 100,000 wage and salary earners in 1996-2007
Number of occupational accidents grew slightly among wage and salary earners but the risk diminished
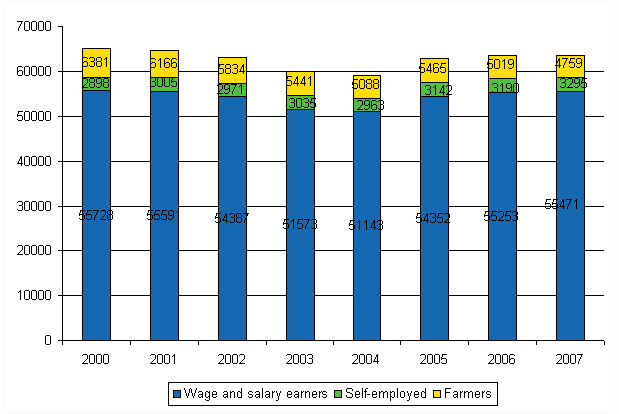
The number of wage and salary earners’ accidents at work was slightly higher in 2007 than one year earlier. In 2007 wage and salary earners had 55,471 accidents at work causing disability of at least four days. This was 218 accidents more than in 2006. The number of accidents has increased from 2004, when there were 51,143 accidents at work causing disability of at least four days. Some of this may be explained by the aforementioned introduction of the full-cost responsibility system of patient care. Farmers’ accidents at work decreased by almost 300 from the year before, but the number of accidents suffered by other self-employed people increased slightly (Figure 2). It must, however, be noted that the accident insurance is voluntary for self-employed persons, so the number of accidents at work may also indicate the popularity of insurance among self-employed persons. Around 40 per cent of self-employed persons are insured against accidents at work.
Figure 2. Changes in the number of accidents at work by status in employment in 2000–2007.
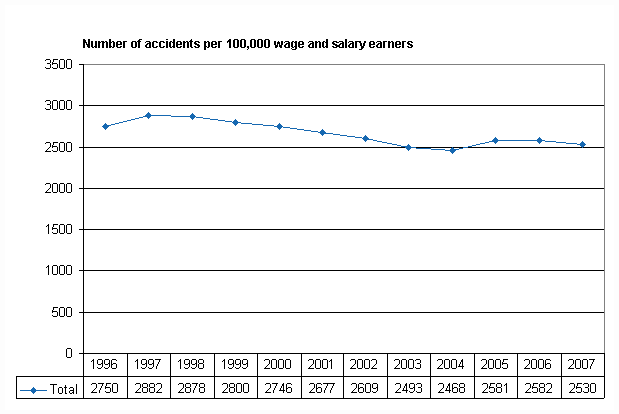
The risk of accidents at work has been falling among Finnish wage and salary earners since the late 1990s (Figure 3). This becomes evident when the number of accidents is expressed as a proportion of 100,000 wage and salary earners. The accident incidence rate fell by some 14 per cent between 1998 and 2004. When measured by the accident incidence rate, the risk of accidents at work fell slightly from the year 2006 (-2.0%). In 2007 a total of 2,530 accidents at work resulting in a disability of at least four days occurred per 100,000 wage and salary earners. The corresponding ratio in 2006 was 2,582.
Figure 3. Wage and salary earners’ accidents at work per 100,000 wage and salary earners in 1996-2007
Accidents at work continue to be a problem among men: nearly three in four accidents at work (73 %) occur to men. Men’s risk of accidents at work has traditionally been clearly higher than that of women. Measured with the accident incidence rate, men’s risk of suffering accidents at work is more than 2.5-fold when compared to women. The key reason for this is that more men than women work in industries and have jobs with a higher than average risk of accidents at work.
Table 2. Wage and salary earners' accidents at work by gender and age in 2007
| Age | Total | Males | Females | |||
| N | % | N | % | N | % | |
| Total | 55 471 | 100 | 40 494 | 100 | 14 977 | 100 |
| 15–24 | 8 249 | 14,9 | 6 186 | 15,3 | 2 063 | 13,8 |
| 25–34 | 12 374 | 22,3 | 9 617 | 23,7 | 2 757 | 18,4 |
| 35–44 | 13 094 | 23,6 | 9 711 | 24,0 | 3 383 | 22,6 |
| 45–54 | 13 647 | 24,6 | 9 647 | 23,8 | 4 000 | 26,7 |
| 55–64 | 7 911 | 14,3 | 5 178 | 12,8 | 2 733 | 18,2 |
| Others | 196 | 0,4 | 155 | 0,4 | 41 | 0,3 |
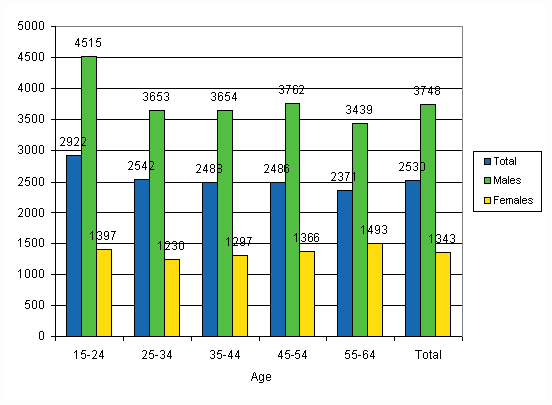
Men's risk of accidents at work is highest among the youngest age group (aged 15 to 24). In 2007 young men had 4,515 accidents at work resulting in at least four days’ absence from work per 100,000 wage and salary earners (Figure 2). This meant that the risk measured with the accident incidence rate was more than 20 per cent higher than the average for wage and salary earner men. Young men’s risk of accidents grew slightly from the previous year (by 2.8 per cent) while that of all wage and salary earner men diminished slightly (by 2.3 per cent). The risk lowers almost steadily with increasing age. Unlike for men, women's risk of accidents is the highest among the oldest age group, that is, the 55 to 64-year-olds. Differences between age groups are, however, fairly small. The picture of the accidents at work situation by gender given by the accident incidence rate has remained nearly stable from one year to the next.
Figure 4. Wage and salary earners’ accidents at work per 100,000 wage and salary earners by gender and age in 2007
Building construction is still the riskiest
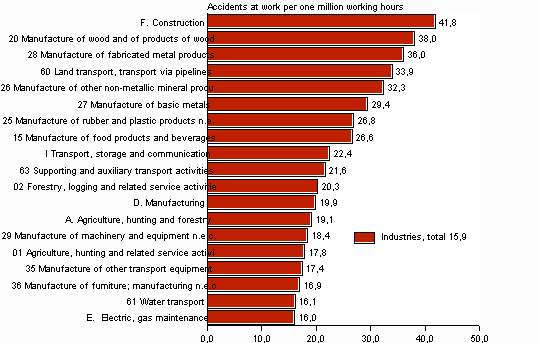
In 2007 industries with a high risk of accidents at work when measured with accident frequency were construction (41.8), manufacture of wood and of products of wood (38.0) and manufacture of fabricated metal products (36.0). Table 5 lists the industries with a higher than average (15.9) accident frequency. The frequencies have been calculated from accidents at work resulting in disability of at least 4 days, fatal accidents excluded. Municipal sector employees have been classified into their own class, as information on their industry is missing from the accidents at work data files. Wage and salary earners in the municipal sector had 9.8 accidents at work per one million hours worked in 2007, while one year previously their accident frequency had been 10.2.
Figure 5. Wage and salary earners’ accidents at work per one million working hours by branch of industry in 2007, accident frequency higher than average
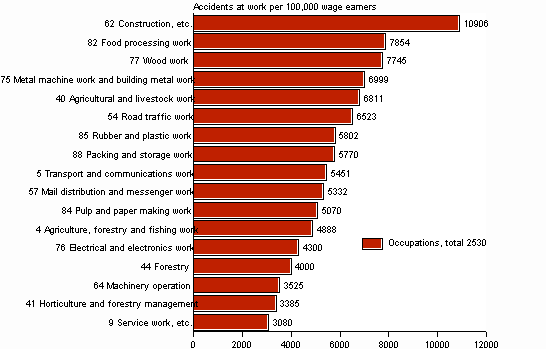
An examination by occupation shows that the accident risk continues to be highest in the occupational group of building construction, where it’s roughly four times as high as the average. In 2007 building construction workers had 10,906 accidents at work resulting in disability of at least 4 days per 100,000 wage and salary earners. One year earlier this accident incidence rate was 11,045.
Building construction was followed by food industry work (7,854), timberwork (7,745) and mechanical engineering and construction metal work (6,999). Figure 8 lists the occupational groups with a higher than average risk of accidents at work. On average, 2,530 accidents at work resulting in disability of at least 4 days occurred per 100,000 wage and salary earners. As in the years before, the number of accidents at work was highest in different occupational groups in manufacturing.
Figure 6. Wage and salary earners’ accidents at work per 100,000 wage and salary earners by occupation in 2007, accident rate higher than average
Similarly to that measured with the accident incidence rate, the risk of accidents at work measured with accident frequency decreased by some 12 per cent during 1998-2004. In 1998 a total of 17.2 accidents at work resulting in at least 4 days’ absence from work occurred per one million hours worked. In 2004 the corresponding accident frequency was down to 15.2. In 2005 the accident frequency rose to 16.1 and remained unchanged in 2006. In 2007, the accident frequency decreased slightly, standing at 15.9.
The accident frequency is a more accurate measure of risk than the accident incidence rate, as it expresses the number of accidents as a proportion of the time (hours worked) during which wage and salary earners were exposed to accidents at work. The hours worked, that is, the time of being exposed to accidents at work can, however, vary from person to person.
Previously Statistics Finland’s occupational accident statistics calculated the accident incidence rate by expressing the accidents at work resulting in at least 3 days' absence from work as a proportion of 1,000 wage and salary earners. The key figures have been harmonised nationally and with the Eurostat practice. The accident incidence rate is now expressed as the number of accidents at work resulting in disability of at least 4 days per 100,000 persons in the reference population. The accident frequency is expressed as the proportion of accidents at work resulting in at least 4 days' absence from work of one million hours worked. The data on the number of wage and salary earners and their hours worked are obtained from Statistics Finland’s Labour Force Survey.
ESAW variables describing the circumstances and manner of accidents at work among wage and salary earners
A revised form on accidents at work was introduced in Finland in 2003 to collect for the first time data on the circumstances and manner of accidents at work according to the European Statistics on Accidents at Work (ESAW). These data are now published for the fifth time in Statistics Finland’s occupational accident statistics for 2007. Compared with the previous year’s statistics the distributions of variables are similar and thus appear fairly reliable. Eurostat’s project is ambitious and the data to be collected are quite detailed at times, which is why the data presented provide a comprehensive picture of the circumstances during the accident at work as well as the causes and consequences.
The Member States are allowed to exercise discretion as to the extent of their data collection. In Finland the data on accidents at work are collected on the key ESAW variables, in some of which only the main category classification is included. The data are given according to the incidence process of the accident at work, so that the prevailing circumstances are described first, then the progress of the event and finally the consequences of the accident. Categories were combined in some of the variables due to presentation reasons. The text section presents mainly distributions by gender and the appended table section distributions by other background variables, such as industry and occupation. In addition to this, data are given only on the basis of the national classification. Such data are e.g. the data on the variable describing the direct cause of the accident at work (see Table 7). An indication that they are in line with the joint European statistics on accidents at work is given in tables and figures based on ESAW statistics.
Most accidents occur when the person is moving
Data are given first about the general circumstances prior to the accident at work. The first ESAW variable describes the working process the wage and salary earner was involved in when the accident occurred. However, the working process does not refer the person’s occupation, because the tasks may vary at different times in the same occupation. Slightly over one third (35.8 %) of men’s accidents at work occurred in working processes related to production, manufacturing, processing or storing. In relative terms, women had the most (43.4 %) accidents in working processes related to public or private services (Table 3).
Table 3. Wage and salary earners’ accidents at work by gender and working process in 2007
| Working process | Total | Males | Females | |||
| N | % | N | % | N | % | |
| Total | 55 471 | 100 | 40 494 | 100 | 14 977 | 100 |
| 10 Production, manufacturing, processing, storing | 17 471 | 31,5 | 14 515 | 35,8 | 2 956 | 19,7 |
| 20 Excavation, construction, repair, demolition | 5 880 | 10,6 | 5 773 | 14,3 | 103 | 0,7 |
| 30 Agricultural type work, forestry, horticulture, fish farming, work with live animals | 1 536 | 2,8 | 934 | 2,3 | 602 | 4,0 |
| 40 Services provided to enterprise and/or to the general public; intellectual activity | 8 412 | 15,2 | 1 909 | 4,7 | 6 503 | 43,4 |
| 50 Other work related to tasks coded under 10, 20, 30 and 40 | 11 110 | 20,0 | 9 104 | 22,5 | 2 006 | 13,4 |
| 60 Movement, sport, artistic activity | 8 637 | 15,6 | 6 342 | 15,7 | 2 295 | 15,3 |
| 99 Other Working Processes no listed above | 708 | 1,3 | 478 | 1,2 | 230 | 1,5 |
| 00 No information | 1 717 | 3,1 | 1 439 | 3,6 | 278 | 1,9 |
The specific physical activity illustrates the person’s exact physical activity just before the moment of injury, while the working process variable describes the general nature of work at the time of the accident. The specific physical activity can be intentional or voluntary, but it need not be of long duration. According to the results, more than every third accident occurred when the person was moving. More of women’s accidents (42.9 %) took place in connection with movement than men’s (31.6 %) (Table 4). Nearly every fifth (19.4 %) accident occurred when the person was carrying a load by hand. Similarly, nearly one fifth (19.5 %) of accidents occurred when handling various objects. In relative terms, men had over 50 per cent more accidents at work when working with hand-held tools than women did.
Table 4. Wage and salary earners’ accidents at work by gender and specific physical activity in 2007
| Specific physical activity | Total | Males | Females | |||
| N | % | N | % | N | % | |
| Total | 55 471 | 100 | 40 494 | 100 | 14 977 | 100 |
| 10 Operating machine | 2 701 | 4,9 | 2 261 | 5,6 | 440 | 2,9 |
| 20 Working with hand-held tools | 7 026 | 12,7 | 6 055 | 15,0 | 971 | 6,5 |
| 30 Driving/being on board a means of transport or handling equipment | 1 322 | 2,4 | 1 021 | 2,5 | 301 | 2,0 |
| 4 Handling of objects | 10 801 | 19,5 | 8 062 | 19,9 | 2 739 | 18,3 |
| 50 Carrying by hand | 10 789 | 19,4 | 7 799 | 19,3 | 2 990 | 20,0 |
| 60 Movement | 19 208 | 34,6 | 12 784 | 31,6 | 6 424 | 42,9 |
| 70 Presence | 1 221 | 2,2 | 786 | 1,9 | 435 | 2,9 |
| 99 Other Specific Physical Activities not listed above | 1 189 | 2,1 | 759 | 1,9 | 430 | 2,9 |
| 00 No information | 1 214 | 2,2 | 967 | 2,4 | 247 | 1,6 |
The cause of accident mostly stumbling, slipping or falling
Next we will examine the progress of the events leading to the actual accident at work. Among women roughly one third (32.0 %) and among men nearly 30 per cent (28.4 %) of accidents at work resulted from stumbling, jumping, slipping or falling (Table 5). The proportions are nearly the same as one year ago. This appears from the data of the deviation variable which describes the unusual occurrence during the physical activity leading to the accident at work. If several deviating events precede the actual accident, the one occurring last is recorded. The second most common event leading to an accident was a sudden physical stress for both men (19.6 %) and women (22.8 %).
Table 5. Wage and salary earners’ accidents at work by gender and deviation in 2007
| Deviation | Total | Males | Females | |||
| N | % | N | % | N | % | |
| Total | 55 471 | 100 | 40 494 | 100 | 14 977 | 100 |
| 10 Deviation due to electrical problems, explosion, fire | 141 | 0,3 | 125 | 0,3 | 16 | 0,1 |
| 20 Deviation by overflow, overturn, leak, flow, vaporisation, emission | 1 509 | 2,7 | 1 174 | 2,9 | 335 | 2,4 |
| 30 Breakage, bursting, splitting, slipping, fall, collapse of Material Agent | 5 876 | 10,6 | 4 557 | 11,3 | 1 319 | 8,8 |
| 40 Loss of control (total or partial) of machine, means of transport or handling equipment, hand-held tool, object, animal | 8 020 | 14,5 | 6 419 | 15,9 | 1 601 | 10,7 |
| 50 Slipping – Stumbling and falling – Fall of persons | 15 777 | 28,4 | 10 989 | 27,1 | 4 788 | 32,0 |
| 60 Body movement without any physical stress (generally leading to an external injury) | 9 087 | 16,4 | 6 939 | 17,1 | 2 151 | 14,4 |
| 70 Body movement under or with physical stress (generally leading to an external injury) | 11 347 | 20,5 | 7 938 | 19,6 | 3 409 | 22,8 |
| 80 Shock, fright, violence, aggression, threat, presence | 1 142 | 2,1 | 463 | 1,1 | 679 | 4,5 |
| 99 Other Deviations not listed above | 1 856 | 3,4 | 1 345 | 3,3 | 511 | 3,4 |
| 00 No information | 716 | 1,3 | 584 | 1,4 | 120 | 0,8 |
Roughly three in ten victims of accidents at work (27.5 per cent) were injured due to horizontal or vertical impact with or against a stationary object (Table 6). This is also indicated in the data of the variable expressing the deviating situation leading to the accident, where stumbling, falling or similar was the most common event leading to the accident. With a few exceptions, the data of these two variables on men and women are almost identical. Roughly every fourth (26.3 %) was injured as a result of sudden physical or mental stress. The mode of injury describes how the injured body part came into contact with the cause of the injury. Where there are several modes of injury, the one causing the most serious injury is recorded.
Table 6. Wage and salary earners’ accidents at work by gender and contact - mode of injury in 2007
| Contact - Mode of injury (ESAW) | Total | Males | Females | |||
| N | % | N | % | N | % | |
| Total | 55 471 | 100 | 40 494 | 100 | 14 977 | 100 |
| 10 Contact with electrical voltage, temperature, hazardous substances | 1 645 | 3,0 | 1 160 | 2,9 | 485 | 3,2 |
| 20 Drowned, buried, enveloped | 17 | 0,0 | 12 | 0,0 | 5 | 0,0 |
| 30 Horizontal or vertical impact with or against a stationary object (the victim is in motion) | 15 236 | 27,5 | 10 542 | 26,0 | 4 694 | 31,3 |
| 40 Struck by object in motion, collision with | 5 880 | 10,1 | 4 626 | 11,4 | 1 254 | 8,4 |
| 50 Contact with sharp, pointed, rough, coarse Material Agent | 8 910 | 16,1 | 7 111 | 17,6 | 1 799 | 12,0 |
| 60 Trapped, crushed, etc. | 6 098 | 11,0 | 4 740 | 11,7 | 1 358 | 9,1 |
| 70 Physical or mental stress | 14 562 | 26,3 | 10 366 | 25,6 | 4 196 | 28,0 |
| 80 Bite, kick, etc. (animal or human) | 945 | 1,7 | 357 | 0,9 | 588 | 3,9 |
| 99 Other Contacts – Modes of Injury not listed in above | 1 798 | 3,2 | 1 292 | 3,2 | 506 | 3,4 |
| 00 No information | 380 | 0,7 | 288 | 0,7 | 92 | 0,6 |
In slightly over 30 per cent of wage and salary earners’ accidents at work the material agent of the injury was different kinds of scaffolding, surfaces and planes (Table 7). Most of these (74%) belonged to the category “passageways, surfaces, ground, doors, walls, windows and obstacles”. Scaffolding, surfaces and planes were the most common modes of injury for both men (30.8 %) and women (34.5 %). Various materials, objects and supplies injured around one quarter of the victims of accidents at work. Most of them were various materials, objects, products, debris or machine components.
The data on the material agent of contact describes the physical factor with which the injured body part was in contact. When several modes are in question those filling in the accident notification form are asked to report the material agent of the most serious injury.
Table 7. Wage and salary earners’ accidents at work by gender and material agent of contact - mode of injury in 2007
| 1) Material Agent of Contact-Mode of injury (FAII) 2) | Total | Males | Females | |||
| N | % | N | % | N | % | |
| Total | 55 471 | 100 | 40 494 | 100 | 14 977 | 100 |
| 1100-1399 Scaffolding, surfaces and planes | 17 088 | 30,8 | 11 918 | 29,4 | 5 170 | 34,5 |
| 2100-2799 Tools, machines and equipment | 9 480 | 17,1 | 7 939 | 20,0 | 1 541 | 10,2 |
| 2801-2899 Conveying, transport and storage equipment | 3 142 | 5,7 | 2 239 | 5,5 | 903 | 6,0 |
| 3100, 3200 Transport equipment | 1 583 | 2,9 | 1 309 | 3,2 | 274 | 1,8 |
| 4100-4400 Materials, objects and supplies | 15 822 | 28,5 | 12 327 | 30,4 | 3 495 | 23,3 |
| 5100 Living organisms and human-beings | 2 748 | 5,0 | 861 | 2,1 | 1 887 | 12,6 |
| 5200 Bulk waste | 404 | 0,7 | 310 | 0,8 | 94 | 0,6 |
| 5300 Physical phenomena and natural elements | 591 | 1,1 | 407 | 1,0 | 184 | 1,2 |
| 9999 Other material agents not listed above | 3 273 | 6,0 | 2 180 | 5,4 | 1 093 | 7,3 |
| 0000 No information | 1 340 | 2,4 | 1 004 | 2,5 | 336 | 2,2 |
2) The classification of the variables is national (FAII = Federation of Accident Insurance Institutions).
The classification describing the material agent is national for accident data on wage and salary earners. The classification is considerably more detailed than before. Two things should be kept in mind when examining the results. Firstly, the occurrence of an accident at work is usually a sum of many factors and no individual material agent can always be identified unambiguously. However, the variable data show what kind of equipment or tools the victim was using or in what kind of working environment the accident occurred. Secondly, inadequate guidance or inexperience on the part of the worker can often play a major role in the occurrence of an accident. It is difficult and often impossible to produce statistics on such factors.
Four out of ten injuries (42.0 %) caused by accidents at work are dislocations, sprains or strains. The next most common were wounds and superficial injuries (26.0 %) and various concussions and internal injuries (16.8 %) (Table 8). Men’s accidents caused relatively more often various wounds and superficial injuries, while women’s accidents caused dislocations, sprains and strains. This is concordant with the results presented above, which showed that men more often than women injure themselves in accidents at work in connection with sharp objects whereas women more than men injure themselves by stumbling or slipping.
Table 8. Wage and salary earners’ accidents at work by gender and type of injury in 2007
| Type of Injury (ESAW) | Total | Males | Females | |||
| N | % | N | % | N | % | |
| Total | 55 471 | 100 | 40 494 | 100 | 14 977 | 100 |
| 010 Wounds and superficial injuries | 14 220 | 26,0 | 11 226 | 27,7 | 3 194 | 21,3 |
| 020 Bone fractures | 5 638 | 10,2 | 4 251 | 10,5 | 1 387 | 9,3 |
| 030 Dislocations, sprains and strains | 23 250 | 42,0 | 16 346 | 40,4 | 6 904 | 46,1 |
| 040 Traumatic amputations (Loss of body parts) | 195 | 0,4 | 170 | 0,4 | 25 | 0,1 |
| 050 Concussions and internal injuries | 9 330 | 16,8 | 6 675 | 16,5 | 2 655 | 17,8 |
| 060 Burns, scalds and frostbites | 1 290 | 2,3 | 855 | 2,1 | 435 | 2,9 |
| 070 Poisonings and infections | 228 | 0,4 | 184 | 0,5 | 44 | 0,3 |
| 080 Drowning and asphyxiations | 2 | 0,0 | 2 | 0,0 | 0 | 0,0 |
| 090 Effects of sound, vibration and pressure | 15 | 0,0 | 11 | 0,0 | 4 | 0,0 |
| 100 Effects of temperature extremes, light and radiation | 21 | 0,0 | 19 | 0,0 | 2 | 0,0 |
| 110 Shocks | 93 | 0,2 | 58 | 0,1 | 35 | 0,2 |
| 120 Multiple injuries | 192 | 0,4 | 131 | 0,3 | 61 | 0,4 |
| 999 Other specified injuries not included under other headings | 437 | 0,8 | 309 | 0,8 | 128 | 0,9 |
| 000 No information | 360 | 0,7 | 257 | 0,6 | 103 | 0,7 |
More than four out of ten accidents at work (43.7 %) involved the upper extremities (Table 9). In some three quarters the injured body parts were the palms or fingers. Nearly 30 per cent injure lower extremities, including hips, thighs, knees, shins and ankles.
Table 9. Wage and salary earners’ accidents at work by gender and injured body part in 2007
| Part of Body Injured (ESAW) | Total | Males | Females | |||
| N | % | N | % | N | % | |
| Total | 55 471 | 100 | 40 494 | 100 | 14 977 | 100 |
| 10 Head | 2 209 | 4,0 | 1 710 | 4,2 | 499 | 3,3 |
| 20 Neck | 578 | 1,0 | 398 | 1,0 | 180 | 1,2 |
| 30 Back, spine | 8 093 | 14,6 | 5 730 | 14,2 | 2 363 | 15,8 |
| 40 Torso, internal organs | 2 557 | 4,6 | 2 046 | 5,1 | 511 | 3,4 |
| 50 Upper extremities | 24 252 | 43,7 | 18 074 | 44,6 | 6 178 | 41,3 |
| 60 Lower extremities | 16 353 | 29,5 | 11 660 | 28,8 | 4 693 | 31,3 |
| 70 Entire body or several body parts | 1 202 | 2,2 | 726 | 1,8 | 476 | 3,2 |
| 99 Others | 132 | 0,2 | 79 | 0,2 | 53 | 0,4 |
| 00 Data missing | 95 | 0,2 | 71 | 0,2 | 24 | 0,2 |
Absence from work 12 days on average
The seriousness of accidents at work can be assessed on the basis of the duration of disability resulting from the injury. The figures describing the length of absence from work before 2002 are not fully comparable with the figures for 2002 to 2007, because it was not earlier possible to separate the cases leading to the employment accident pension. The cases leading to employment accident pension are always serious, but in some of the cases the recorded number of days absent may have been low before the decision on the pension was granted. Now pension cases are excluded from the examination of the duration of disability.
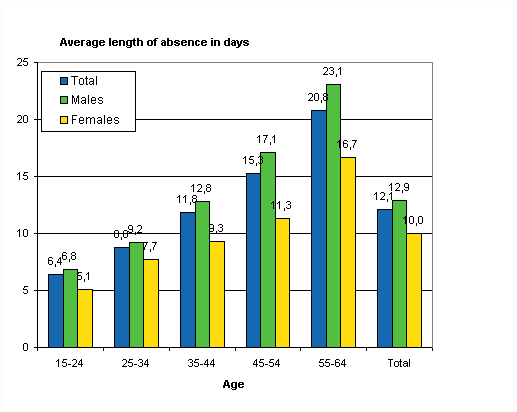
The average duration of an absence from work due to an accident at work was 12 days (12.1) in 2007. The average duration of disability was 12.9 days for men and 10.0 days for women. The average duration of absence caused by accidents increased with age for both men and women (Figure 7). Included are also accidents at work leading to a disability lasting under four days.
Figure 7. Average length of absence of wage and salary earners' accidents at work by gender and age in 2007
Slightly under one third (30.0 %) of all accidents leading to disability lasting at least four days caused disability of four to six days, and around 17 per cent of the accidents – including employment accident pension cases – were serious, causing absences lasting longer than 30 days (Table 10).
Table 10. Wage and salary earners’ accidents at work by gender and length of disability in 2007
| Duration of disability - days | Total | Males | Females | |||
| N | % | N | % | N | % | |
| Total | 55 471 | 100 | 40 494 | 100 | 14 977 | 100 |
| 4–6 days | 16 622 | 30,0 | 11 887 | 29,3 | 4 745 | 31,7 |
| 7–14 days | 20 122 | 36,3 | 14 587 | 36,0 | 5 535 | 37,0 |
| 15–30 days | 9 310 | 16,8 | 6 928 | 17,1 | 2382 | 15,9 |
| 31–90 days | 6 694 | 12,1 | 5 009 | 12,4 | 1 685 | 11,3 |
| 91–182 days | 1 649 | 3,0 | 1 243 | 3,1 | 406 | 2,7 |
| 183–365 days | 949 | 1,7 | 740 | 1,8 | 209 | 1,4 |
| Employment accident pension | 125 | 0,2 | 110 | 0,3 | 15 | 0,1 |
Risk of commuting accidents fell slightly
In 2007 wage and salary earners had a total of 18,397 commuting accidents for which insurance companies paid compensation. Disability of at least four days resulted from 8,912 of these accidents. In the statistics commuting accidents are separated from accidents at work and accidents while in work traffic. A commuting accident refers to an accident on the journey between home and work. Due to incomplete information in claims forms, some commuting accidents are in practice recorded as accidents at work and vice versa.
The number of commuting accidents decreased slightly from 2006, as there were about 18,397 commuting accidents that year, of which 9,332 led to disability of at least four days. By contrast, the number of fatal commuting accidents grew clearly from the year before. In 2007 a total of 25 people died while commuting, whereas in 2006 the corresponding number was 16. The long-term development of the number of commuting accidents is examined in more detail in Appendix Table 4.
Commuting accidents differ from accidents at work in that they are more common among women than men; nearly two out of three (65.1 %) of all commuting accidents occurred to women. In 2002-2006 the proportion was nearly the same, at roughly 64 per cent. By contrast, in 2007 fatal commuting accidents occurred to men more often than to women: 13 of them occurred to men and 12 to women. This means that the number of the fatal commuting accidents that occurred to women doubled from 2006, totalling 6.
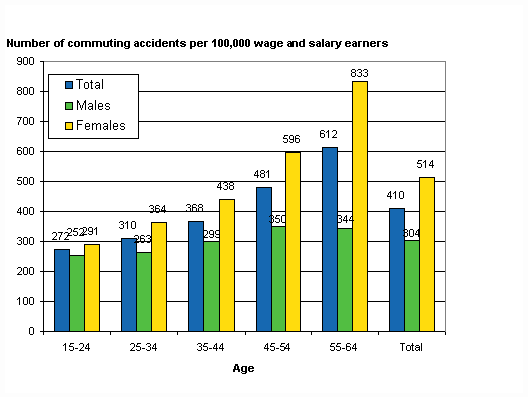
The accident incidence rate of commuting accidents diminished slightly. In 2007, there were 410 commuting accidents per 100,000 wage and salary earners. Both in 2006 and 2005 the corresponding incidence rate was 439. Women had 514 (543 in 2006) and men 304 (322 in 2006) commuting accidents per 100,000 wage and salary earners in 2007.
The difference between men and women stays the same when looking at the accident incidence rates in different age groups (Figure 8). Both men’s and women’s risk of commuting accidents increases with age, but women’s risk is still higher than men’s in all age groups. The risk of getting injured on the way to or from work is 2.5-fold among women aged 55 to 64 in comparison with the youngest age group. The relative difference between men and women is also biggest in the oldest age group.
Figure 8. Wage and salary earners' commuting accidents per 100,000 wage and salary earners by gender and age in 2007
Most commuting accidents occur when walking or cycling: almost six out of ten (57 %) of those injured in commuting accidents were walking and nearly every fourth (24 %) were cycling when injured. The differences between men and women in commuting accidents by mode of travel were not large: women get injured slightly more often than men when walking, while men have more passenger car accidents than women (Figure 9). It is not possible to take into account in the statistics the differences between women and men in their frequency of using a bicycle or a car on the journey between home and work.
Figure 9. Wage and salary earners' commuting accidents by mode of travel and gender in 2007
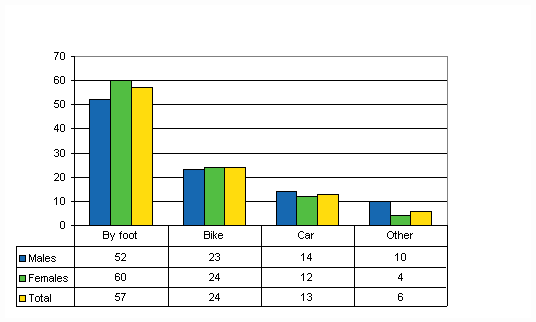
When considering the modes of travel it is natural that the most common type of accident is falling, slipping or stumbling. In 2007 three quarters (73 %) of all commuting accidents resulted from falling or slipping. The second most common type of accident is ’collision with a car’ Some 11 per cent of all commuting accidents resulted from collisions with a car (Table 11).
Table 11. Wage and salary earners’ commuting accidents by gender and type of accident in 2007
| Type of accident | Total | Males | Females | |||
| N | % | N | % | N | % | |
| Total | 8 9122 | 100 | 3 252 | 100 | 5 660 | 100 |
| Falling, slipping or stumbling | 6 513 | 73,1 | 2 234 | 68,7 | 4 279 | 75,6 |
| Stepping on objects | 73 | 0,8 | 31 | 1,0 | 42 | 0,7 |
| Driving off the road or car falling over | 668 | 7,5 | 308 | 9,5 | 360 | 6,4 |
| Collision with a car | 1 008 | 11,3 | 430 | 13,2 | 578 | 10,2 |
| Collision with a bicycle, moped, etc. | 170 | 1,9 | 44 | 1,4 | 126 | 2,2 |
| Collision with a track-going vehicle | 3 | 0,0 | 1 | 0,0 | 2 | 0,0 |
| Violence | 29 | 0,3 | 12 | 0,4 | 17 | 0,3 |
| Others | 448 | 5,0 | 192 | 5,9 | 256 | 4,5 |
Most of the injuries caused by commuting accidents were minor, often caused by falling. In more than four cases out of ten, the victim’s injuries were various dislocations of joints, sprains and strains (Table 12). The injured body parts were often the extremities (Table 13).
Table 12. Wage and salary earners' commuting accidents by type of injury in 2007
| Type of Injury (ESAW) | Total | Males | Females | |||
| N | % | N | % | N | % | |
| Total | 8 912 | 100 | 3 252 | 100 | 5 660 | 100 |
| 010 Wounds and superficial injuries | 865 | 9,7 | 314 | 9,7 | 551 | 9,7 |
| 020 Bone fractures | 1 1778 | 20,0 | 670 | 20,6 | 1 108 | 19,6 |
| 030 Dislocations, sprains and strains | 3 975 | 44,6 | 1 516 | 46,6 | 2 459 | 43,4 |
| 040 Traumatic amputations (Loss of body parts) | 4 | 0,0 | — | — | 4 | 0,1 |
| 050 Concussions and internal injuries | 1 971 | 22,1 | 651 | 20,0 | 1 320 | 23,3 |
| 060 Burns, scalds and frostbites | 8 | 0,1 | 3 | 0,1 | 5 | 0,1 |
| 070 Poisonings and infections | 3 | 0,0 | 1 | 0,0 | 2 | 0,0 |
| 090 Effects of sound, vibration and pressure | — | — | — | — | — | — |
| 110 Shocks | 13 | 0,1 | 3 | 0,1 | 10 | 0,2 |
| 120 Multiple injuries | 150 | 1,7 | 44 | 1,4 | 106 | 1,9 |
| 999 Other specified injuries not included under other headings | 45 | 0,5 | 11 | 0,3 | 34 | 0,6 |
| 000 No information | 100 | 1,1 | 39 | 1,2 | 61 | 1,1 |
Table 13. Wage and salary earners' commuting accidents by gender and injured body part in 2007
| Part of Body Injured (ESAW) | Total | Males | Females | |||
| N | % | N | % | N | % | |
| Total | 8 912 | 100 | 3 252 | 100 | 5 660 | 100 |
| 10 Head | 353 | 3,8 | 117 | 3,4 | 266 | 4,0 |
| 20 Neck | 518 | 5,7 | 178 | 5,3 | 340 | 5,9 |
| 30 Back, spine | 661 | 7,4 | 286 | 10,3 | 375 | 8,3 |
| 40 Torso, internal organs | 661 | 7,4 | 325 | 9,8 | 336 | 5,8 |
| 50 Upper extremities | 2 578 | 30,1 | 978 | 29,8 | 1 600 | 30,2 |
| 60 Lower extremities | 3 180 | 35,1 | 1 077 | 33,6 | 2 103 | 35,9 |
| 70 Entire body or several body parts | 851 | 8,3 | 259 | 7,2 | 592 | 9,0 |
| 99 Others | 28 | 0,2 | 10 | 0,2 | 18 | 0,2 |
| 00 Data missing | 52 | 0,5 | 22 | 0,3 | 30 | 0,6 |
Self-employed persons’ accidents at work
This section focuses on the accidents at work of farmers and other self-employed persons. Self-employed persons’ (excl. farmers) accidents at work were separated in the occupational accident statistics from wage and salary earners’ accidents at work for the first time in 1995. Before that self-employed persons’ accidents were included as such in wage and salary earners’ accidents at work. When examining the figures on self-employed persons’ accidents at work it must be noted that an accident insurance is voluntary for self-employed persons, and not all of them are insured. Therefore the distribution of self-employed persons’ accidents at work according to different background variables (age, occupation, industry) also illustrates in which occupations and sectors self-employed persons are more insured than usual.
In Finland most farmers live on their farms, which makes it impossible to separate accidents at work and commuting accidents from each other. In this publication all accidents occurring to farmers in their work are referred to as accidents at work. The accidents at work data on farmers are based on the data obtained from the Farmers’ Social Insurance Institution (MELA).
In addition to a full-time and working age farmer, the insured can be a pensioner, an under 18-year-old family member or a person practising part-time agriculture, forestry, reindeer husbandry or fishing industry. The number of farmers has decreased steadily during the last few years. At the end of 2007 there were 86,549 farmers insured by the Farmers’ Social Insurance Institution, which is about 1,000 fewer than one year previously and over 55,000 fewer than in 1995.
Farmers’ accidents at work decreased
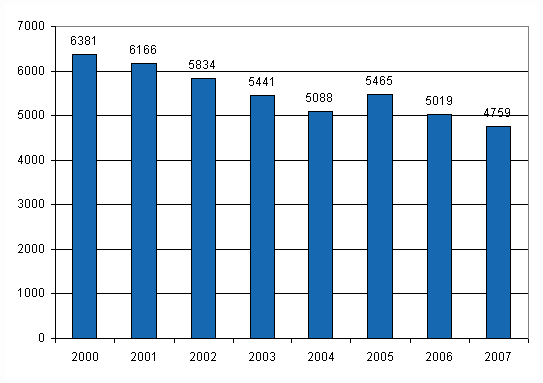
The changes in the numbers of farmers are also visible in the numbers of accidents at work. MELA paid farmers compensation for a total of 5,795 accidents at work that had occurred in the course of 2007. The figure is down by around 200 cases from the previous year. There were a total of 4,759 occupational accidents leading to disability of at least four days, while in the previous year the respective figure was 5,019. The number of farmers’ accidents at work has been falling during the past seven years, the year 2005 excluded (Figure 10).
Figure 10. Farmers’ non-fatal accidents at work with at least 4 days’ absence in 2000–2007
Farmers’ risk of death at work increased
Of all accidents at work compensated in 2007, eight caused the death of the farmer, while in the previous year five farmers died as a result of an accident. All farmers who died in accidents at work were men. Of all the fatal accidents at work of farmers in 2000-2007 only one occurred to a woman. This accident occurred in 2005. Figure 11 presents the accident incidence rates of farmers, with regard to deaths at work and accidents leading to disability of at least four days from 2000 to 2007. The figure shows that the risk of death at work varies strongly in different years. In 2007, 9.2 per 100,000 insured farmers died, while in 2006 the corresponding ratio was 5.6 and in 2005 9.8. The year 2000 was the darkest in the near past; a total of 12.9 per 100,000 insured farmers died in accidents at work.
Figure 11. Farmers’ accident rates in 2000–2007
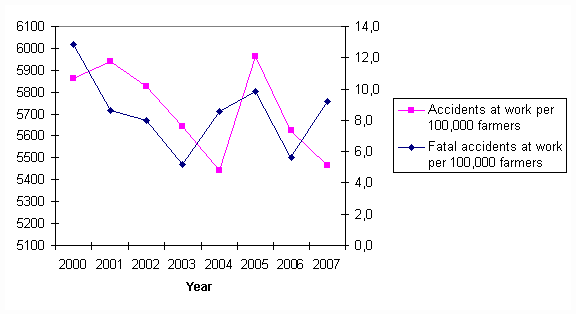
Table 14 compares the incidence rate of accidents leading to the death of the farmer with the riskiest industries among wage and salary earners in 2006 and 2007. Because the majority of persons who die as the result of accidents at work are generally men, their accident incidence rates are given separately. The figures indicate that farmers’ work was the most dangerous. A total of 14.0 farmers lost their lives per 100,000 insured farmers in 2007. One year earlier, the risk of death at work was highest in transport, storage and communication. In 2007, the risk of death at work in this industry was 6.5 per 100,000 insured wage and salary earner. The second most risky industry among wage and salary earners was construction. In 2007 a total of 6.4 men per 100,000 insured wage and salary earners lost their lives in the construction industry. In 2006 the corresponding figure was 7.9.
Table 14. Farmers’ fatal accidents at work compared with wage and salary earners’ fatal accidents in high risk branches of industry per 100,000 farmers or wage and salary earners in 2006–2007
| Year 2006 | Year 2007 | |||
| Total | Males | Total | Males | |
| Farmers | 5,6 | 8,6 | 9,2 | 14,0 |
| Wage and salary earners | 2,2 | 4,1 | 1,7 | 3,0 |
| Industry | 1,7 | 2,3 | 1,2 | 1,6 |
| Construction | 7,3 | 7,9 | 5,9 | 6,4 |
| Transport, storage and communication | 8,1 | 11,5 | 5,2 | 6,5 |
The proportion of minor accidents at work, resulting in disability of less than four days, has stayed roughly level in the past few years, at about ten per cent of all compensated accidents. Nearly every third (32 %) accident at work was a so-called serious accident, i.e. they caused a disability lasting longer than one month (Appendix Table 5). In the following the focus will be on those accidents at work that resulted in an absence of at least four days.
Farmers’ risk of accident at work continues to decrease
Farmers’ risk of accidents declined in the early 2000s (Figure 12). In 2007 there were 5,465 occupational accidents per 100,000 insured farmers, which is slightly fewer than in 2006 (5,627). The accident peak in 2005 could in part be the result of the introduction that year of the full-cost responsibility system of patient care. Farmers’ risk of accidents is, however, still clearly higher than that of wage and salary earners and distinctly higher for men than for women: men had 6,323 and women 3,835 accidents at work per 100,000 insured farmers (Figure 12). This difference between the genders is partly explained by the fact that in farming men conventionally undertake the kind of work in which accidents are common. Such work includes, e.g. construction work and tasks related to the use and maintenance of machinery and equipment.
Figure 12. Farmers’ accident at work per 100 000 insured by gender and age in 2007
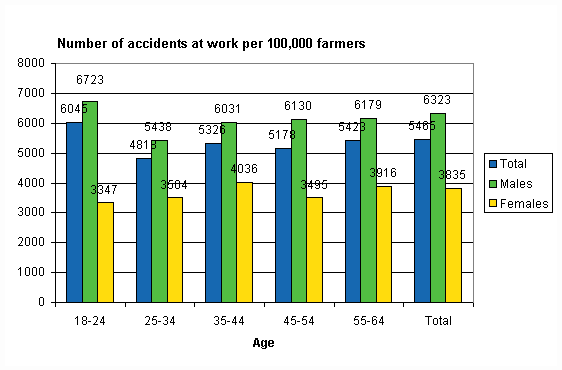
Nearly two thirds (65 %) of farmers’ accidents occur to over 45-year-olds. The age distributions of men and women to whom accidents occurred are similar. In 2007 the number of accidents at work was relatively the highest in the age group of under 25-year-olds (6,045). The annual variation of their accident risk can be quite large, as the number of insured farmers belonging to the youngest age group is rather small.
Most accidents occur in animal husbandry
The proportion of accidents occurring in various animal husbandry tasks was similar to their proportion one year previously. Especially women fell victims to accidents at work when tending cattle; more than three fourths (76 %) of women’s accidents at work took place in animal husbandry. The respective proportion among men was slightly over one-third (35 %) (Table 15). The second greatest number of accidents occurred in other agriculture and forestry work, including tasks such as installation and maintenance of machinery and equipment. Less than one-fifth (15 %) of accidents at work occurred while performing other tasks related to farming. On the basis of the available statistical data no actual conclusions can, however, be drawn on the dangerousness of work in different areas, because then the amount of working time used on different tasks should also be known. The classification of the variable describing the stage of work is national. The classification used by MELA is more detailed than the ESAW variable illustrating the working process.
Table 15. Farmers' accidents at work by type of work and gender in 2007
| Total | Males | Females | ||||
| N | % | N | % | N | % | |
| Total | 4 759 | 100 | 3 607 | 100 | 1 152 | 100 |
| Farming work | 724 | 15,2 | 624 | 17,3 | 100 | 8,7 |
| Animal husbandry | 2 118 | 44,5 | 1 244 | 34,5 | 874 | 75,9 |
| Forest work | 416 | 8,7 | 385 | 10,7 | 31 | 2,7 |
| Construction work | 312 | 6,6 | 291 | 8,1 | 21 | 1,8 |
| Other agricultural and forestry work | 1 048 | 22,0 | 929 | 25,8 | 119 | 10,3 |
| Other work | 141 | 3,0 | 134 | 3,7 | 7 | 0,6 |
In roughly one-third of the cases (37 %) the deviation leading to an accident of the farmer was falling, jumping, stumbling or slipping. Violence, a shocking situation or a non-standard practice (e.g. neglected protection) was the reason behind the accident in one-fourth of the cases (23 %).
Farmers most often injured as a consequence of horizontal or vertical impact with or against a stationary object
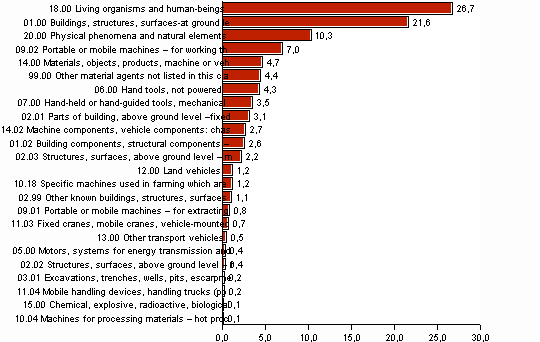
Horizontal or vertical impact with or against a stationary object was the most common mode of injury for farmers. In three cases out of ten (30 %) the person was injured due to horizontal or vertical impact with or against the floor, ground or similar (Figure 13). Women farmers were pushed or kicked by an animal more often than men, as every fourth (25 %) of women farmers’ accidents was caused by an animal. Every tenth (11 %) man injured in an accident was hurt by an animal bite, kick or similar. In over one fourth of farmers’ accidents at work (27%) the material agent was an animal or a human-being, or the injury was caused by a plant (Figure 14). In all probability most of these farmers' accidents were caused by animals. Various buildings, structures and surfaces were the material agents in every fifth accident (22 %). Physical phenomena and elements caused 10 per cent of the accidents at work. The Farmers’ Social Insurance Institution collects data on the material agents using the ESAW classification.
Figure 13. Farmers' accidents at work by contact-mode of injury (ESAW) and gender in 2007
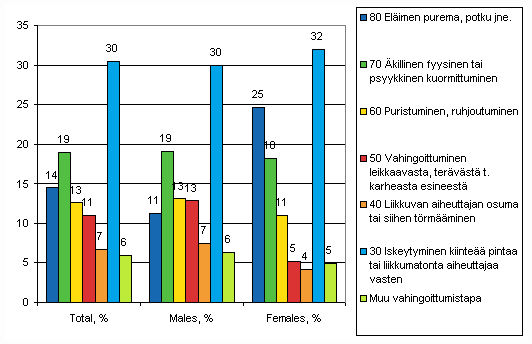
Figure 14. Farmer's accidents by material agent of contact-mode of injury in 2007
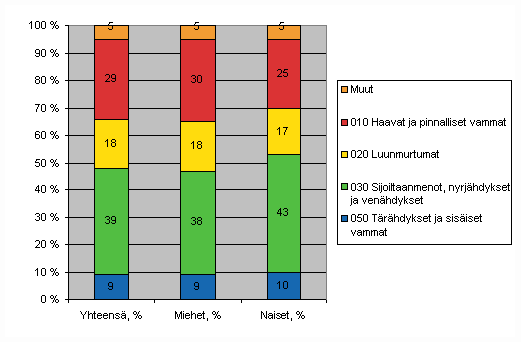
In 2007, a total of 39 per cent of farmers’ injuries sustained in accidents at work were various kinds of dislocations, sprains and strains. Wounds and superficial injuries form another big group of injuries (29%). Nearly every fifth (18 %) of all injuries to farmers were bone fractures. There were no significant differences in the distributions of men’s and women’s injuries: men’s injuries were more often wounds and superficial injuries, while women’s injuries were different kinds of sprains and strains (Figure 15).
Figure 15. Farmers' accidents at work by type of injury and gender in 2007
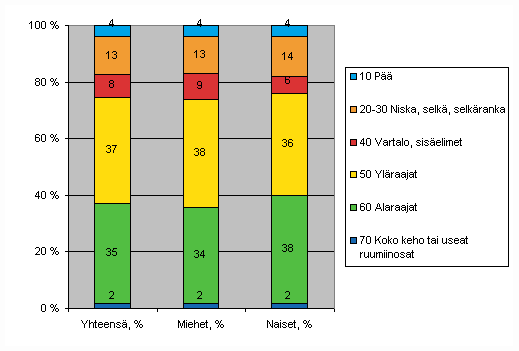
About seven out of ten (72 %) of all the accidents at work which occurred to farmers concerned extremities (Figure 24). Women injured their lower extremities more often than men did, while men's injuries concerned their upper extremities. Injuries to lower extremities most often involved knees and those to upper extremities palms or fingers.
Figure 16. Farmers' accidents at work by injured body part and gender in 2007
Self-employed persons most often injured in manufacturing occupations and building construction
In 2007 insurance companies paid self-employed persons compensation for a total of 5,659 accidents at work. This also includes accidents on which compensation was paid only for medical treatment expenses. The proportion of these accidents at work that led to absence from work of less than four days was about 40 per cent of all self-employed persons’ accidents. One year previously compensation was paid for 5,422 accidents. The data concern self-employed persons other than farmers.
In 2007 self-employed persons suffered from 3,295 accidents at work that led to disability lasting at least four days. This is 105 cases more than in the year before. The gender distribution of accidents at work among self-employed persons is the same as among wage and salary earners: most (86 %) of the accidents of self-employed persons occurred to men. The age distribution of victims of accidents at work show that around two-thirds (62 %) of self-employed persons’ accidents occurred in the age group of the 35 to 54-year-olds (Table 16).
Table 16. Self-employed person's accidents at work by gender and age in 2007
| Age | Total | Males | Females | |||
| N | % | N | % | N | % | |
| Total | 3 295 | 100 | 2 834 | 100 | 461 | 100 |
| 15–24 | 50 | 1,5 | 46 | 1,6 | 4 | 0,9 |
| 25–34 | 437 | 13,3 | 371 | 13,1 | 66 | 14,3 |
| 35–44 | 984 | 29,9 | 872 | 30,8 | 112 | 24,3 |
| 45–54 | 1 067 | 32,4 | 912 | 32,2 | 155 | 33,6 |
| 55–64 | 693 | 21,0 | 591 | 20,9 | 102 | 22,1 |
| Others | 64 | 1,9 | 42 | 1,5 | 22 | 4,8 |
Similarly to wage and salary earners, self-employed persons also had the highest numbers of accidents at work in manufacturing occupations and building construction. Examined by industry, self-employer persons’ risk industries are also mostly the same as those of wage and salary earners. The most dangerous industries are construction and transport, storage and communication. The variables describing the causes and consequences of self-employed persons’ accidents are examined more closely in Appendix Tables 6 to 10.
Source: Occupational accident statistics 2007, Statistics Finland
Inquiries: Arto Miettinen 09–1734 2963
Director in charge: Riitta Harala
Updated 30.11.2009
Official Statistics of Finland (OSF):
Occupational accident statistics [e-publication].
ISSN=1797-9544. 2007,
Wage and salary earners’ accidents at work
. Helsinki: Statistics Finland [referred: 7.2.2026].
Access method: http://stat.fi/til/ttap/2007/ttap_2007_2009-11-30_kat_001_en.html

