Published: 22 October 2010
Labour costs EUR 45,000 per employee in 2008
Corrected on 5 November 2010.
The tables of the release have been revised. The corrections are
indicated in red. The changes also have an effect on the database
table.
According to Statistics Finland's labour cost survey, labour costs
amounted, on average, to EUR 45,000 per staff-year in 2008. The
cost was highest in secondary production, about EUR 50,000 and in
central government, about EUR 49,000. The local government sector
had the lowest costs, around EUR 41,000.
Labour costs per hour worked and employee in 2008
| Sector | Labour cost | |
| EUR/hour worked | EUR 1,000/employee | |
| Sectors total | 27.4 | 45.0 |
| Private sector total | 27.5 | 46.0 |
| - Secondary production | 29.8 | 50.2 |
| - Services | 25.9 | 43.0 |
| Local government | 26.1 | 41.5 |
| Central government | 31.2 | 49.3 |
The figures of labour costs statistics do not include primary production or enterprises with fewer than ten employees. Cost differences are mainly explainable by pay levels. The pay level of central government is higher than that of other sectors and the pay development there has also been faster than in the private and local government sectors in the mid-2000s.
The number of hours worked per staff-year is lower in the public sector than in the private sector, which is mainly due to longer annual leaves in the public sector. For this reason the total labour costs of central government per employee remain slightly below the figures for secondary production. In the local government sector wage costs are so low that despite the lower number of hours worked total labour costs remain on level with services in the private sector.
Of labour costs 75 per cent wages and salaries
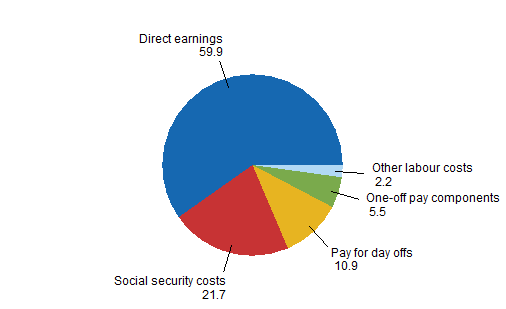
Of all labour costs, 76.3 per cent are wages and salaries. The share of 1.7 per cent of pay during periods of sickness and parental leave included in social security can also be added here. The share of direct earnings, or wages and salaries paid for hours worked is 59.9 per cent. The most significant differences by sector are due to larger shares of holiday pay and higher social cost tariffs in the public than in the private sector.
Structure of labour costs in 2008, per cent

One-off pay components include performance-based bonuses, holiday bonuses, seniority increments and compensations for on-call duty and the like. Their share was higher in the private sector than in the public sector and this is explained by the share of performance-based bonuses, 2.5 per cent.
The labour cost survey 2008 is part of the statistics of all Member States of the European Union concerning 2008, on which Eurostat will publish information later on.
Source: Labour cost survey 2008. Statistics Finland
Inquiries: Pentti Jonninen (09) 1734 3581, tvk@tilastokeskus.fi
Director in charge: Kari Molnar
Publication in pdf-format (284.8 kB)
- Tables
-
Tables in databases
Pick the data you need into tables, view the data as graphs, or download the data for your use.
Appendix tables
Updated 22.10.2010
Official Statistics of Finland (OSF):
Labour cost survey [e-publication].
ISSN=1799-3288. 2008. Helsinki: Statistics Finland [referred: 10.2.2026].
Access method: http://stat.fi/til/tvtutk/2008/tvtutk_2008_2010-10-22_tie_001_en.html

