Published: 12 March 2015
Economic dependency ratio weakened in 2013
Corrected on 12 March 2015 at 9:30 am. The corrections are indicated in red .
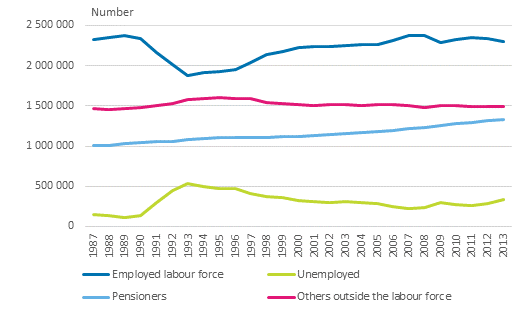
According to the data of Statistics Finland's employment statistics for the year 2013, the economic dependency ratio weakened by five from the previous year. In 2013, there were 137 non-employed persons per one hundred employed persons, while one year earlier the figure was 132. In the period 1987 to 2013, the dependency ratio was highest in the year of recession 1993 (172) and lowest in 1989, when there were 112 non-employed persons per one hundred employed persons.
Population's main type of activity in 1987 to 2013

The economic dependency ratio is calculated by dividing the number of unemployed, pensioners and other inactive population by the number of employed persons and by multiplying the figure obtained by one hundred. A fall in the economic dependency ratio is thus regarded as positive and a rise as negative. In addition to variations in economic cycles and development of employment, the economic dependency ratio is affected by the birth rate, population structure and migration.
Regional differences in the economic dependency ratio were large. Åland (106) and Uusimaa (111) had the lowest economic dependency ratios in 2013. The economic dependency ratios were highest in Etelä-Savo (165), North Karelia (169) and Kainuu (177). The economic dependency ratios weakened between 2012 and 2013 in all regions, most in Kainuu, Central Finland and Päijät-Häme. The dependency ratio weakened least in Åland. Between 2003 and 2008, the economic dependency ratio improved all over Finland, after which it has weakened in all regions. In some of the regions, the dependency ratio rose by as many as 20 between 2008 and 2013 (Appendix table 2).
The growing number of unemployed and pensioners particularly raises the economic dependency ratio. According to the employment statistics, the number of unemployed and pensioners has increased by over 100,000 between 2011 and 2013. The number of unemployed was 71,600 higher in 2013 than two years earlier and 47,000 higher than one year previously. The number of pensioners went up by nearly 20,300 from 2012 to 2013 and by a total of 36,300 in the two previous years. In ten years, the number of pensioners has grown by over 175,000 .
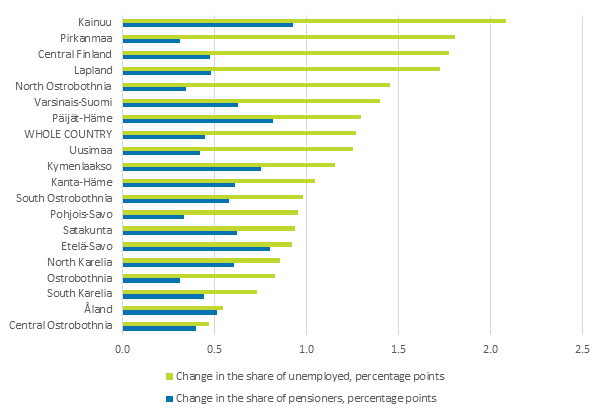
Examined by region, the share of pensioners in total population grew between 2011 and 2013 most in Kainuu and Päijät-Häme and least in Pohjois-Savo and Ostrobothnia. The growing share of unemployed persons weakened the economic dependency ratio particularly in Kainuu, Pirkanmaa and Central Finland. From 2011 to 2013, the share of unemployed grew by 2.1 percentage points in Kainuu and by around 1.8 percentage points in Pirkanmaa and Central Finland.
Change in the share of pensioners and unemployed persons in the population by region in 2011 to 2013, percentage points

Source: Employment Statistics, Statistics Finland
Inquiries: Laura Lohikoski 029 551 3396, tyossakaynti@stat.fi
Director in charge: Riitta Harala
Publication in pdf-format (227.2 kB)
- Tables
-
Tables in databases
Pick the data you need into tables, view the data as graphs, or download the data for your use.
Appendix tables
Updated 12.3.2015
Official Statistics of Finland (OSF):
Employment [e-publication].
ISSN=2323-6825. Industry, employer sector and jobs 2013. Helsinki: Statistics Finland [referred: 17.2.2026].
Access method: http://stat.fi/til/tyokay/2013/04/tyokay_2013_04_2015-03-12_tie_001_en.html

