Published: 24 May 2019
Unemployment made a downturn even among long-term unemployed
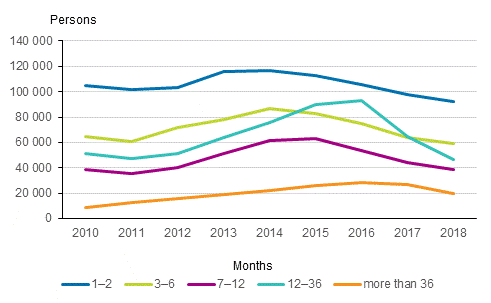
According to Statistics Finland's employment statistics, the number of unemployed job seekers at the end of 2018 decreased by 13.5 per cent from the year before to 256,500 unemployed persons. From the peak level of unemployed persons in 2015, the number has decreased by 118,400 persons. The peak of prolonged unemployment was broken one to two years later than for shorter term unemployment.
Number of unemployed at the end of the year by the duration of unemployment in 2010 to 2018

Statistics Finland's employment statistics describe the economic activity of the population at the end of the year. In 2018, there were 256,500 unemployed job seekers, and unemployment had lasted continuously for at least a year for 25.8 per cent of them. There were most unemployed among those aged 55 to 64 (64,900 unemployed) and 25 to 34 (55,300) and least among those aged 16 to 24 (33,800). Men represented 56.6 per cent of all unemployed. The difference between the sexes in the number of unemployed was biggest for those aged 16 to 24 (62.0% men) and smallest for those aged 35 to 44 (54.5% men).
Long-term unemployment made a downturn in 2017
In time series examination, the number of unemployed persons at the end of the year rose from 2011 to 2015 by 46.0 per cent to 374,900. In 2015 to 2018, the number of unemployed persons decreased by 118,400 persons to around the 2011 level. In the early 2010s, both shorter term and longer term (continuous) unemployment increased by almost as much 1) .
In the decrease in unemployment that followed the unemployment peak, shorter term unemployment turned downward starting from 2014 and 2015 and long-term unemployment one to two years later. During 2016 to 2018, the number of persons who had been unemployed for over a year fell from 121,700 to 66,200 unemployed. It should be noted that the drop in unemployment between 2016 and 2017 is partially explained by the periodic interviews with unemployed job seekers that began in 2017 and that helped remove an estimated 20,000 to 30,000 persons from the job seeker register. In the past, this type of population has especially been classified as long-term unemployed.
Unemployment more long-term among older age groups, men and highly educated
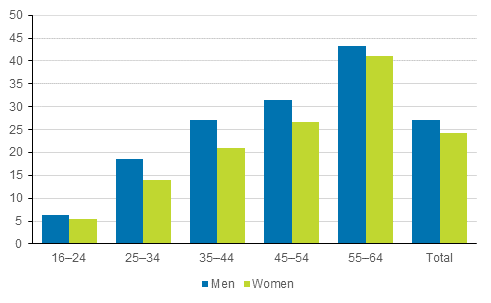
Share of persons having been unemployed for over a year of the unemployed by sex and age group in 2018, %

Differences between population groups in the duration of unemployment was measured with the long-term unemployment rate, which here is defined as the share of those who had been unemployed for over a year of all unemployed. In 2018, men’s long-term unemployment rate was 27.1 per cent and women’s 24.1 per cent.
The share of those who had been unemployed for over a year was clearly higher in the older age groups: share for those aged 16 to 24 was 6.0 per cent, 24.3 per cent for those aged 35 to 44 and 42.3 per cent for those aged 55 to 64. On average, unemployment lasted for a shorter period for women in all age groups. The difference in the long-term unemployment rate between sexes was highest (6.0 percentage points) for those aged 35 to 44 and lowest (0.8 percentage points) for those aged 16 to 24.
In 2018, the long-term unemployment rate was higher in higher educational groups 2) . For those with basic level qualifications 3) the share of those who had been unemployed for over one year was 24.3 per cent and for those with vocational qualifications or matriculation examination it was 25.2 to 25.9 per cent. For those with tertiary level degrees 4) the long-term unemployment rate was clearly higher, 31.3 per cent. In light of this figure, higher education does not seem to protect against unemployment becoming prolonged. On the other hand, some of the differences between the educational groups is explained by the higher average age of persons in the higher education groups. In addition, all qualifications that exceeded upper secondary level qualifications were classified as tertiary level qualifications (incl. post-secondary qualifications).
1) The duration of unemployment calculated based on consecutive unemployment days. Unemployment is divided into the following categories: 1 to 2 months=0 to 74 days, 3 to 6 months=75 to 196 days, 6 to 12 months=197 to 365 days, 12 to 36 months=366 to 1,095 days, over 36 months=over 1,095 days.
2) Education level (highest qualification) of the unemployed at the end of 2018 was deduced from the latest data on education from 2017. This limited the unemployed in the education level examination to those belonging to the 2017 population (in total 252,982 unemployed at the end of 2018 belonged to the 2017 population).
3) The group of those with comprehensive school education includes persons with lacking data on qualifications after comprehensive school. They include persons having passed and persons having discontinued the comprehensive school and those whose educational background is unknown or who have completed a post-compulsory qualification abroad.
4) Tertiary level qualifications include all qualifications higher than upper secondary level qualifications, that is, lowest tertiary level, lower tertiary level and higher tertiary level degrees.
Source: Employment Statistics, Statistics Finland
Inquiries: Juhana Nordberg 029 551 3051, info@stat.fi
Director in charge: Jari Tarkoma
Publication in pdf-format (224.2 kB)
- Tables
-
Tables in databases
Pick the data you need into tables, view the data as graphs, or download the data for your use.
Appendix tables
- Appendix table 1. Number of unemployed at the end of the year by the duration of unemployment in 2010 to 2018 (24.5.2019)
- Appendix table 2. Share of persons having been unemployed for over a year of the unemployed by sex and age group in 2018, % (24.5.2019)
- Appendix table 3. Unemployed at the end of 2018 and share of long-term unemployed by region (24.5.2019)
Updated 24.5.2019
Official Statistics of Finland (OSF):
Employment [e-publication].
ISSN=2323-6825. Background information on unemployed persons 2018. Helsinki: Statistics Finland [referred: 17.2.2026].
Access method: http://stat.fi/til/tyokay/2018/02/tyokay_2018_02_2019-05-24_tie_001_en.html

