Published: 17 June 2021
Number of passengers in foreign shipping traffic fell by 65 per cent in 2020 but goods transport remained almost unchanged
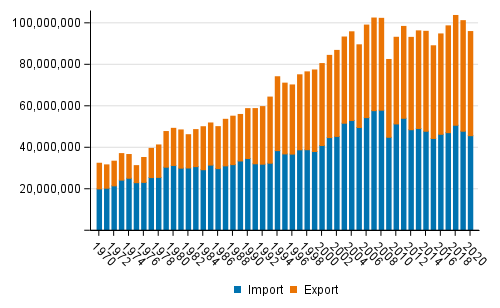
The coronavirus pandemic had a strong impact on the number of passengers in foreign shipping traffic, which fell by 65 per cent compared with 2019. The number of passengers travelling through Finnish ports was 6.7 million in 2020. Nearly all passengers transported by sea travelled on routes to Estonia and Sweden. During 2020, the goods volume of foreign sea transport totalled 96.0 million tonnes. Sea transport went down by five per cent from the year before. Exports fell by six per cent and totalled 50.2 million tonnes. Imports went down by four per cent and amounted to 45.8 million tonnes. A total of 2.4 million transport equipment were transported. Of them, 53 per cent were passenger cars belonging to passengers.
Foreign sea transport (tonnes) 1970–2020

Goods transport
The goods volume of foreign sea transport was in total 96.0 million tonnes. Of this, transit transport made up nine per cent, or 8.4 million tonnes. General cargo was transported most, 16.5 million tonnes, followed by 11.3 million tonnes of crude oil. The most imported type of goods was crude oil, which represented 25 per cent of all goods imported by sea. Oil products, general cargo and paper were exported most. These types of goods form 46 per cent of all goods exports in sea transport. The busiest ports for goods transport were Sköldvik, HaminaKotka, Helsinki, Kokkola and Naantali. The largest import ports were Sköldvik, Helsinki, Naantali, Raahe and HaminaKotka. The biggest export ports were HaminaKotka, Sköldvik, Helsinki, Kokkola and Rauma. Table 1.
Table 1. Volume of goods transported in foreign sea transport by type of goods in 2018 to 2020
| Direction and commodity group | Vuosi | |||
| 2018 | 2019 | 2020 | ||
| Export | Timber | 839,970 | 714,705 | 482,449 |
| Sawn wood | 3,749,891 | 3,962,493 | 3,798,860 | |
| Wood pulp | 3,600,683 | 3,874,226 | 3,943,835 | |
| Paper | 8,157,124 | 7,563,773 | 6,467,012 | |
| Plywood and veneers | 259,001 | 245,719 | 212,822 | |
| Ores and concentrates | 5,001,231 | 4,367,797 | 4,660,187 | |
| Metals and metal manufactures | 3,338,673 | 2,887,695 | 2,910,408 | |
| Crude oil | 9 | 40 | 68 | |
| Oil products | 8,935,661 | 9,166,173 | 8,768,395 | |
| Coal and coke | 973,354 | 1,365,453 | 799,305 | |
| Fertilizers | 3,096,333 | 3,577,862 | 3,649,634 | |
| Chemicals | 3,403,378 | 3,557,791 | 3,518,461 | |
| Crude minerals and cement | 1,150,091 | 1,454,668 | 1,336,861 | |
| Cereals | 415,069 | 547,694 | 778,348 | |
| General cargo | 9,002,069 | 8,701,379 | 7,860,184 | |
| Other merchandise | 998,984 | 1,317,860 | 1,016,253 | |
| Total | 52,921,521 | 53,305,328 | 50,203,082 | |
| Import | Timber | 3,167,139 | 3,022,638 | 3,002,951 |
| Sawn wood | 36,216 | 32,219 | 33,711 | |
| Wood pulp | 430,809 | 309,255 | 215,435 | |
| Paper | 208,360 | 212,113 | 253,996 | |
| Plywood and veneers | 32,547 | 39,346 | 37,052 | |
| Ores and concentrates | 4,855,165 | 4,274,233 | 4,372,708 | |
| Metals and metal manufactures | 1,279,761 | 1,370,915 | 1,412,315 | |
| Crude oil | 11,889,441 | 11,939,810 | 11,314,437 | |
| Oil products | 4,767,546 | 4,658,124 | 4,907,966 | |
| Coal and coke | 4,254,867 | 3,407,649 | 2,597,314 | |
| Fertilizers | 256,369 | 259,915 | 281,736 | |
| Chemicals | 2,815,815 | 2,669,110 | 2,479,932 | |
| Crude minerals and cement | 4,779,894 | 4,024,729 | 3,839,014 | |
| Cereals | 124,896 | 62,498 | 62,165 | |
| General cargo | 9,214,655 | 8,877,333 | 8,617,850 | |
| Other merchandise | 2,744,086 | 2,823,196 | 2,400,071 | |
| Total | 50,857,566 | 47,983,083 | 45,828,653 | |
Goods transport in containers and transport equipment
A total of 11.9 million tonnes of goods were transported in containers through Finnish ports in 2020. The figure was 8.7 per cent lower than in 2019. The number of containers transported was 840,137 (1,494,014 TEU containers) 1) . Measured in tonnes, exports of goods transported in containers went down by 9.5 per cent and imports by 6.7 per cent compared to 2019.
A total of 15.6 million tonnes of goods were transported by goods transport equipment and 1.12 million transport equipment were transported in total. Of goods transport equipment, lorries and lorry trailers were transported most, in all 1.09 million. A total of 29,892 other transport equipment were transported. The volume of goods transported by transport equipment and containers totalled 27.5 million tonnes, which is 29 per cent of all goods transported in sea transport.
Transport performance of foreign sea transport
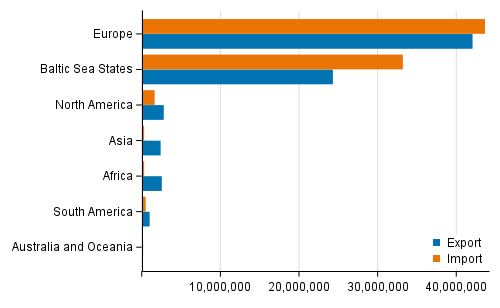
During 2020, the transport performance of foreign sea transport totalled 211.7 billion tonne-kilometres. The transport performance of exports amounted to 143.1 billion tonne-kilometres and that of imports to 68.6 billion tonne-kilometres. In all, 72 per cent of goods imported by foreign sea transport came from countries in the Baltic Sea area and only five per cent from other than European ports. Altogether 48 per cent of export goods were exported to the Baltic Sea area countries and 16 per cent were exported outside European ports. Differences in import and export countries are reflected directly in the transport performance. The transport performance fell by nine per cent compared with 2019.
Exports and imports by area year 2020

Transit transport
Transit transport through Finnish ports totalled 8.4 million tonnes. Most of this was transit exports, 7.9 million tonnes. Transit imports amounted to 0.6 million tonnes The majority of transit exports consists of ores and concentrates, as well as fertilisers, chemicals and coal and coke. These groups of goods form 96 per cent of transit shipments. Over one-half of transit imports are general cargo. Transit transport went down by six per cent from 2019. Export transit declined by six per cent and import transit by five per cent.
Table 2. Volume of goods transported in transit traffic by type of goods in 2018 to 2020
| Direction and commodity group | Vuosi | |||
| 2018 | 2019 | 2020 | ||
| Export | Timber | 938 | 96 | 203 |
| Sawn wood | 15,916 | 27,703 | 15,428 | |
| Wood pulp | 10,517 | 3,146 | 178 | |
| Paper | 19,245 | 29,781 | 2,868 | |
| Plywood and veneers | 2,166 | 1,437 | 1,535 | |
| Ores and concentrates | 3,947,160 | 3,147,988 | 3,045,453 | |
| Metals and metal manufactures | 22,845 | 28,189 | 42,736 | |
| Crude oil | - | - | 68 | |
| Oil products | 66,315 | 94,598 | 144,784 | |
| Coal and coke | 840,139 | 1,167,260 | 646,170 | |
| Fertilizers | 1,707,391 | 2,122,805 | 2,202,479 | |
| Chemicals | 1,560,445 | 1,658,448 | 1,668,945 | |
| Crude minerals and cement | 3,145 | 883 | 14 | |
| Cereals | 2,786 | 5,044 | 3,508 | |
| General cargo | 79,974 | 93,120 | 83,944 | |
| Other merchandise | 24,775 | 17,013 | 11,130 | |
| Total | 8,303,757 | 8,397,511 | 7,869,443 | |
| Import | Timber | - | 24 | 1,533 |
| Sawn wood | 14,499 | 23,524 | 15,833 | |
| Wood pulp | 1,227 | 1,056 | 631 | |
| Paper | 4,789 | 1,963 | 1,697 | |
| Plywood and veneers | 1,582 | 3,818 | 9,001 | |
| Ores and concentrates | 204 | 592 | 357 | |
| Metals and metal manufactures | 72,891 | 55,518 | 58,598 | |
| Crude oil | - | 14 | 68 | |
| Oil products | 235 | 410 | 6,510 | |
| Coal and coke | 1,101 | 3,166 | 4,661 | |
| Fertilizers | 1,203 | 27 | 96 | |
| Chemicals | 53,219 | 48,403 | 43,528 | |
| Crude minerals and cement | 9,515 | 9,021 | 14,274 | |
| Cereals | 331 | 313 | 124 | |
| General cargo | 468,014 | 316,096 | 335,405 | |
| Other merchandise | 97,618 | 126,797 | 69,601 | |
| Total | 726,428 | 590,742 | 561,917 | |
Passenger transport
A total of 6.7 million persons were transported in passenger traffic in 2020. In all, 4.1 million persons travelled between Finland and Estonia and 2.3 million between Finland and Sweden. Between Finland and Germany 0.1 million passengers were transported, almost no passengers were transported between Finland and Russia. The number of passengers fell by 65 per cent compared to 2019. In January, no passengers of foreign cruise ships arrived in Finland. In 2020, a total of 1.3 million passengers’ cars were transported and 8,264 buses and coaches. Transports of passengers’ cars decreased by 41 per cent and bus transports decreased by 79 per cent.
Volume of transport through the Saimaa Canal
A total of 1,191,842 tonnes of goods were transported through the Saimaa Canal in foreign traffic. Timber was transported most in vessels in foreign traffic, in total 523,854 tonnes. The second most transported were crude minerals and cement, 294,592 tonnes. The volume of traffic through the Saimaa Canal increased by 22 per cent from 2019.
1) TEU, the basic measurement unit of container traffic, refers to one container that is twenty feet long, eight feet wide and 8.5 feet high.
Source: Transport and tourism, Statistics Finland
Inquiries: Matti Kokkonen 029 551 3770, matti.kokkonen@stat.fi
Head of Department in charge: Hannele Orjala
Publication in pdf-format (210.1 kB)
- Tables
-
Tables in databases
Pick the data you need into tables, view the data as graphs, or download the data for your use.
Updated 17.06.2021
Official Statistics of Finland (OSF):
Foreign Shipping Traffic [e-publication].
ISSN=2670-2002. 2020. Helsinki: Statistics Finland [referred: 9.2.2026].
Access method: http://stat.fi/til/uvliik/2020/uvliik_2020_2021-06-17_tie_001_en.html

