1. Gross domestic product fell by 1.2 per cent last year
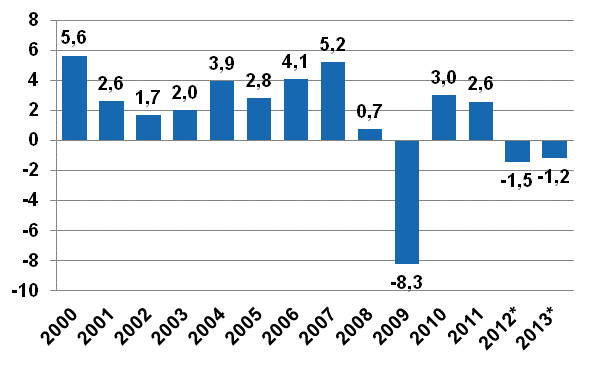
According to Statistics Finland's revised preliminary data, the volume of Finland’s GDP contracted by 1.2 per cent in 2013. According to the initial preliminary data released in March, the decrease was 1.4 per cent. The GDP became revised as new data on intermediate consumption in manufacturing and other industries became available.
In 2012, the volume of GDP contracted by 1.5 per cent whereas previous estimates put the decline at one per cent. The revision was partly the result of decreased research and development expenditure.
Figure 1. Annual change in the volume of gross domestic product, per cent

Measured by nominal value, gross domestic product, or the value added created in the production of goods and services, amounted to EUR 201 billion last year and thus exceeded EUR 200 billion to the first time.
Households' adjusted disposable income describing their economic well-being declined by 0.3 per cent in real terms last year. In addition to net income, adjusted income also takes into consideration welfare services produced by the public sector and organisations for households, such as educational, health and social services.
National accounts have started using the new system of national accounts (ESA 2010) used in the European Union and new time series have been backcasted starting from the year 1975. The main changes made to time series are explained in the statistical release under "Changes in these statistics"
1.1. Production contracted in most industries
Production contracted for the second year in a row last year and was at the 2006 level. The volume of value added decreased in nearly all main industries, for example, in manufacturing, construction, trade, transport, administrative and support service activities, financial and insurance activities, and administrative and support service activities. The volume of value added grew most in the manufacture of basic metals, the chemical industry and the forest industry.
Viewed by current price, value added increased most in the manufacture of basic metals, energy supply, health and social work activities, and real estate activities. Value added decreased most in the manufacture of machinery and equipment, financial and insurance activities, and building construction.
1.2. Demand did not generate growth
Demand items in the national economy remained at previous year's level or declined. The volume of consumption expenditure remained unchanged. Private consumption expenditure decreased by 0.7 per cent, of which 0.4 percentage points was the result of the abandonment of TV licence fees and the introduction of the public service broadcasting tax. The volume of public consumption expenditure grew by 1.5 per cent of which approximately one percentage point was caused by the same change.
The volume of investments decreased by 4.9 per cent. Investments in nearly all types of goods decreased. Only investments in civil engineering constructions and transport equipment grew somewhat. The investment rate in accordance with the revised National Account, or the ratio of investments to gross domestic product was 21.2 per cent, the lowest since 1996.
The volume of exports shrunk by 1.7 per cent and that of imports by 2.5 per cent. The volume of goods exports and imports increased slightly but the imports and exports of services decreased clearly.
1.3. Work input decreased last year
According to the National Accounts, the number of employed persons declined by 38,000 last year. Job vacancies decreased most in manufacturing and trade and increased in health and social services. Hours worked diminished by 80 million hours or nearly two per cent.
The productivity of labour in the whole national economy, i.e. gross value added at constant prices divided by number of hours worked improved by 0.6 per cent last year.
1.4. Prices went up a little
The economy’s overall price level rose by 2.4 per cent last year as measured by the GDP price index.
The Consumer Price Index went up by 1.5 per cent, but the price index of household consumption expenditure in National Accounts by 2.6 per cent. In National Accounts, the prices of housing services are measured with changes in market rents, whereas the Consumer Price Index also takes into consideration the expenditure on owner-occupied housing. The methods used in National Accounts and in the Consumer Price Index for measuring development in the prices of insurance and financial intermediation services also deviate from each other.
The terms of trade improved by 0.3 per cent because import prices fell by slightly more than export prices.
1.5. National income contracted by 1.6 per cent in real terms
Net national income grew by 0.8 per cent in nominal terms last year, and stood at EUR 30,000 per capita. Net national income went down by 1.6 per cent in real terms. Finland’s gross national income was EUR 202 billion in 2013, i.e. slightly higher than GDP. The gross national income also diminished in real terms last year.
Households’ wage and salary income increased by 0.5 per cent in 2013 and employers’ social contributions by one per cent. In all, the share of compensation of employees of national income was 61.9 per cent. The respective proportion in the previous year was 62 per cent. Property and entrepreneurial income in the national economy decreased by 1.2 per cent and their share of the national income fell to 21.8 per cent. The respective proportion in the previous year was 22.3 per cent.
1.6. Non-financial corporations’ profits unchanged
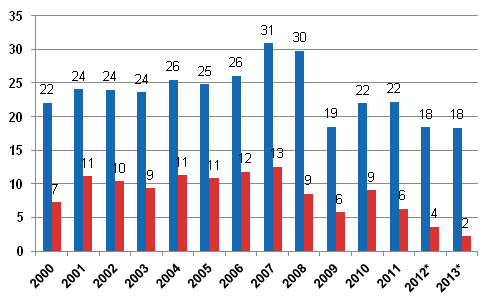
Non-financial corporations' operating surplus describing profits from their actual operations remained at previous year's level. By contrast, their entrepreneurial income grew by five per cent, because foreign investments were estimated to have generated more profit. Entrepreneurial income also takes into consideration property income and paid interests, and corresponds roughly with profit before payment of taxes and dividends.
Non-financial corporations paid 9 per cent more both direct taxes and dividends than in the previous year. The net saving of non-financial corporations diminished by EUR 1.4 billion from the previous year.
Figure 2. Non-financial corporations, operating profit from the operations proper before payment of taxes and dividends, etc. (= operating surplus, left column) and after (= net saving, right column), EUR billion

Non-financial corporations’ net lending, or financial position, showed a surplus of EUR 4.3 billion, as against EUR 3.6 billion in the previous year. The financial position was improved by the fact that fixed investments in Finland diminished by 9 per cent last year.
Financial corporations’ interest income (financial intermediation services indirectly measured) remained at the previous level, but commission income increased. The credit and deposit stock continued to rise but the level of interest rates was lower than in the year before. Non-financial corporations’ net lending, or financial position, was in balance, while it was EUR 1.2 billion in surplus in the previous year. The surplus in 2012 was boosted by one-off tax refunds and the surplus in 2013 was depressed by, for example, increased internal expenses for bank groups.
1.7. General government deficit 2.3 per cent of GDP
Last year, the financial position of central government showed a notable deficit for the fifth successive year. The deficit (net borrowing) was EUR 7 billion, while one year before it was EUR 7.3 billion.
State revenues from taxes went up by 4 per cent. Tax revenues grew most as result of a one percentage point rise in the value added tax. Implementation of the public service broadcasting tax and the bank tax also increased tax revenues.
Income transfers to local government (incl. repayments of value added tax) went up by 2.9 per cent and those to social security funds, for example, to the Social Insurance Institution of Finland by 4.4 per cent. By contrast, interest expenses decreased.
In nominal terms, final consumption expenditure rose by 4.9 per cent and investments by 2.4 per cent. A majority of the growth in expenditure was a result of the Finnish Broadcasting Company being transferred from non-financial corporations to the central government sector from the beginning of 2013.
The deficit of local government was EUR 1.6 billion, having been EUR 2.1 billion in the year before. The deficit was lowered by a 7.1 per cent growth in tax revenue, which was affected by adjustments to municipalities' revenue share. Consumption expenditure grew by 2.9 per cent and investments by 7.4 per cent.
The surplus of employment pension schemes decreased from the previous year. The surplus was now EUR 3.8 billion, while one year before it was EUR 4.8 billion. The surplus does not include holding gains in assets. Revenues from pension contributions grew by less than before, 1.5 per cent, but employment pensions paid by employment pension funds increased by 7.1 per cent. Other social security funds' financial position was in balance, while it was EUR 0.4 billion in surplus in the previous year.
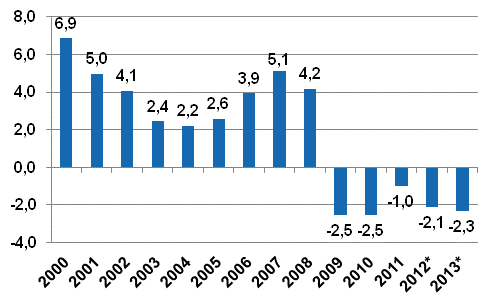
Non-financial corporations’ net lending, or financial position, showed a deficit of EUR 4.7 billion, while the deficit was EUR 4.2 billion in the previous year. Last year, the deficit was 2.3 per cent of GDP.
Figure 3. General government surplus/deficit, per cent of GDP

General government's share of the gross value added that describes the size of the public economy was 21.2 per cent. The proportion of public expenditure to GDP grew to 57.8 per cent. In the previous year the figure was 56.3 per cent.
The tax ratio, or the proportion of taxes and statutory social security contributions of GDP, was 44 per cent last year. The tax ratio increased by 1.2 percentage points from the previous year.
1.8. Growth in households’ real income has stopped
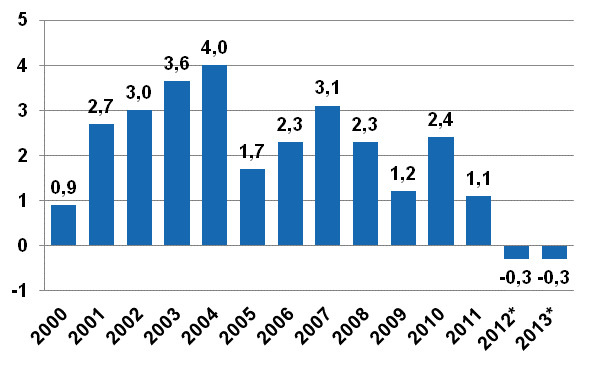
In 2013, households’ disposable income increased by 1.9 per cent in nominal terms but decreased by 0.6 per cent in real terms. Households’ adjusted disposable income grew by 2 per cent in nominal terms but went down by 0.3 per cent in real terms. Adjusted income also takes into consideration welfare services, i.e. the individual services that general government and organisations produce for households, such as educational, health and social services.
Figure 4. Year-on-year change in households’ adjusted real income, per cent

Households’ wage and salary income went up by 0.5 per cent and social benefits by 5.8 per cent. The wages and salaries sum went up due to the risen level of earnings as employment weakened. Social benefits increased because the number of pensioners and unemployed grew. Households’ property and entrepreneurial income went up by 3.2 per cent.
Direct taxes paid by households increased by 4.1 per cent, i.e. more than income.
In 2013, households’ final consumption expenditure increased by 1.9 per cent in nominal terms. Money spent on housing and food grew the most. Less money than before was spent on car purchases, home furnishings and home maintenance. Consumption expenditure was lower than the disposable income. The savings rate, i.e. the ratio of savings to disposable income, was positive at 1.4 per cent in 2013.
Households’ fixed investments went down by 0.7 per cent in nominal terms as housing construction decreased slightly. The financial position of households showed a deficit of EUR 3.9 billion, while the deficit in the previous year was EUR 4.6 billion.
Households’ indebtedness rate was 118.2 per cent at the end of 2013, in other words, it grew by one percentage point over the year. The indebtedness rate expresses the ratio between the loans and annual disposable net income in accordance with financial accounts.
1.9. Current accouts still in deficit
The deficit of the current account was EUR 4.1 billion in 2013, while one year before it was EUR 3.8 billion. When imports are also valued at FOB price (at the border of the export country) and not at CIF price (at the border of the import country), as is done in the foreign trade statistics of Finnish Customs, the goods trade showed a deficit of EUR 0.4 billion.
The balance of services trade showed a deficit of EUR 1.5 billion. Sligthly less property income was received from the rest of the world than was paid to it. The current transfer outflow was clearly higher than received income transfers.
1.10. Next revisions in January 2015
National Accounts for 2012 and 2013 will next be revised in January 2015.
These revised preliminary data are based on the information on economic development that was available by 4 July 2014. More information on the national accounts methods can be found on Statistics Finland’s website at: http://tilastokeskus.fi/til/vtp/men_en.html .
Source: National Accounts, Statistics Finland
Inquiries: Olli Savela 029 551 3316, Tuomas Rothovius 029 551 3360, kansantalous@stat.fi
Director in charge: Leena Storgårds
Updated 11.7..2014
Official Statistics of Finland (OSF):
Annual national accounts [e-publication].
ISSN=1798-0623. 2013,
1. Gross domestic product fell by 1.2 per cent last year
. Helsinki: Statistics Finland [referred: 10.2.2026].
Access method: http://stat.fi/til/vtp/2013/vtp_2013_2014-07-11_kat_001_en.html

