

Significance of loans on the decline, that of guarantees growing
1. Subsidies by size category of enterprises
In 2019, slightly over eight per cent of enterprises received business subsidies. Direct business subsidies, loans and guarantees granted are here regarded as business subsidies. The total number of enterprises covered by business subsidies was 27,848, of which 67.4 per cent were micro enterprises. However, relative to all enterprises operating in Finland, only 6.2 per cent of micro enterprises received business subsidies. In all, 22 per cent of small enterprises and 36.1 per cent of medium size enterprises received business subsidies. Over one-half of large enterprises received business subsidies. The turnover of enterprises having received business subsidies represented 40 per cent of the turnover of all enterprises and the personnel of those having received subsidies represented 39 per cent of the personnel of all enterprises.
Apart from large enterprises, enterprises having received subsidies were bigger by personnel but smaller by turnover than enterprises not having received subsidies. For example, 36.1 per cent of the personnel of medium-size enterprises work in enterprises that have received subsidies, but only 29 per cent of the turnover comes from enterprises having received subsidies.
Table 1. Amount of enterprises, their turnover and personnel of enterprises having received subsidies compared to all enterprises by enterprises' size-class in 2019
| Size-class of enterprise 1) | Number of enterprises | Number of enterprises having received subsidies, % 2) | Turnover of enterprises having received subsidies,% 3) | Employed persons of enterprises having received subsidies, % 4) |
| Micro enterprise | 302 545 | 6.2 | 0.9 | 1.1 |
| Small enterprise | 34 305 | 22.0 | 5.0 | 7.5 |
| Medium-sized enterprise | 3 230 | 36.1 | 6.1 | 7.3 |
| Large enterprise | 680 | 53.7 | 28.1 | 23.0 |
| Total number of enterprises 2019 | 340 760 | 8.2 | 40.1 | 38.9 |
2) Share of enterprises having received subsidies of all enterprises
3) Turnover of enterprises having received subsidies compared to the turnover of all enterprises
4) Share of personnel in enterprises having received subsidies of personnel in all enterprises
The amount of direct subsidies grew by half a per cent to around EUR 476 million. The amount of loans decreased by 9.6 per cent to EUR 314 million. The amount of guarantees was EUR 806 million, which is 9.4 more than in the year before.
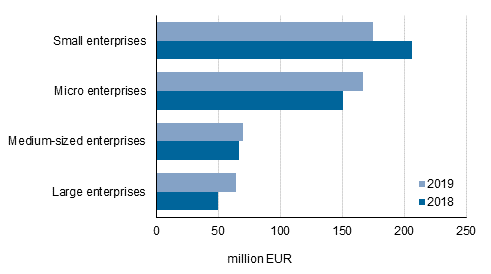
Compared to the previous year, the amount of direct subsidies has mainly grown, but for small enterprises the amount of subsidies has fallen clearly to EUR 174.5 million. The fall was almost EUR 32 million. Direct subsidies to micro enterprises grew by EUR 16 million and those to large enterprises by over EUR 14 million. Although the growth in subsidies granted to large enterprises is relatively big, subsidies are still on a clearly lower level than in 2017.
Figure 1: Paid direct subsidies by size category of enterprises in 2018 to 2019
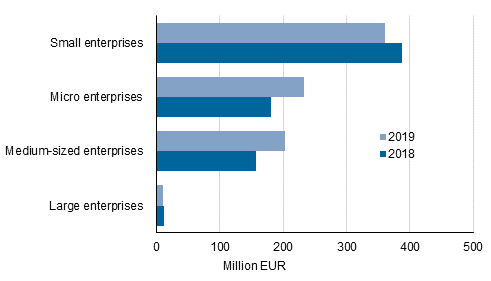
Apart from large enterprises, the amount of loans has fallen clearly, although large enterprises receive loans of under EUR seven million in total. Loans received by micro enterprises have fallen most, by nearly EUR 19 million. Small enterprises received most loans, EUR 157.3 million, micro enterprises EUR 82.5 million and medium size enterprises EUR 67.3 million. The amount of guarantees has grown and small enterprises receive most guarantees despite a fall of EUR 27 million. The guarantees of micro enterprises grew to EUR 232.2 million and those of medium-size enterprises grew by nearly EUR 50 million to EUR 203.7 million. Small enterprises receive most loans and guarantees, but their amount is falling. In micro and medium-sized enterprises, the significance of loans decreases and that of guarantees grows. Large enterprises receive few loans and guarantees.
Figure 2: Size of loans paid to enterprises by size category of enterprises in 2018 to 2019
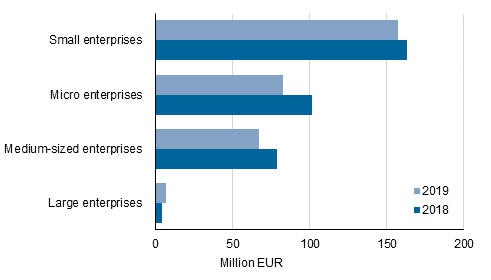
Figure 3: Size of guarantees granted to enterprises by size category of enterprises in 2018 to 2019
Examined in the longer term, the amount of business subsidies has been falling. In 2014, a total of 36,936 enterprises received business subsidies, in 2019 the figure was 27,848. Direct subsidies were paid considerably more in 2014 to 2015, after which the amount of subsidies fell significantly in 2016. The amount of direct subsidies has increased after that. In 2015, the amount of loans paid was EUR 487.6 million, while four years later EUR 314 million were paid. On the other hand, the amount of guarantees is growing: in 2014, the amount of guarantees granted was EUR 670.8 million, which is nearly EUR 136 million less than in 2019. The amount of subsidies has changed most clearly among micro enterprises, where direct subsidies and loans have clearly decreased, but on the other hand, guarantees have grown.
Table 2: Number of enterprises receiving subsidies, paid direct subsidies, loans and guarantees by size category of enterprises in 2014 to 2019, EUR thousand
| Year | Variable | Size-class of enterprise 1) | ||||
| Micro enterprises | Small enterprises | Medium-sized enterprises | Large enterprises | Total | ||
| 2019 | Number of enterprises | 18 778 | 7 540 | 1 165 | 365 | 27 848 |
| Paid direct subsidies | 167 042 | 174 518 | 70 254 | 64 190 | 476 004 | |
| Paid loans | 82 486 | 157 292 | 67 336 | 6 893 | 314 006 | |
| Guarantees granted | 232 191 | 360 455 | 203 737 | 9 930 | 806 312 | |
| 2018 | Number of enterprises | 18 722 | 7 969 | 1 111 | 345 | 28 147 |
| Paid direct subsidies | 150 991 | 206 300 | 66 620 | 49 708 | 473 618 | |
| Paid loans | 101 257 | 163 062 | 78 611 | 4 364 | 347 293 | |
| Guarantees granted | 181 186 | 387 499 | 156 618 | 11 625 | 736 927 | |
| 2017 | Number of enterprises | 19 132 | 7 835 | 1 092 | 353 | 28 412 |
| Paid direct subsidies | 162 412 | 186 770 | 55 232 | 78 876 | 483 290 | |
| Paid loans | 116 126 | 146 004 | 72 153 | 24 743 | 359 027 | |
| Guarantees granted | 187 662 | 356 553 | 165 358 | 4 160 | 713 734 | |
| 2016 | Number of enterprises | 16 873 | 7 484 | 1 071 | 320 | 25 748 |
| Paid direct subsidies | 147 739 | 167 466 | 58 492 | 84 986 | 458 684 | |
| Paid loans | 124 820 | 179 989 | 68 396 | 15 567 | 388 772 | |
| Guarantees granted | 195 633 | 360 927 | 171 172 | 2 350 | 730 082 | |
| 2015 | Number of enterprises | 20 129 | 8 762 | 1 188 | 374 | 30 453 |
| Paid direct subsidies | 181 866 | 190 498 | 76 945 | 85 808 | 535 117 | |
| Paid loans | 202 250 | 194 061 | 72 839 | 18 493 | 487 643 | |
| Guarantees granted | 162 489 | 350 753 | 181 017 | 26 591 | 720 849 | |
| 2014 | Number of enterprises | 24 596 | 10 582 | 1 331 | 427 | 36 936 |
| Paid direct subsidies | 209 415 | 188 156 | 69 976 | 100 257 | 567 803 | |
| Paid loans | 132 364 | 181 058 | 47 310 | 2 831 | 363 563 | |
| Guarantees granted | 136 234 | 316 844 | 188 071 | 29 619 | 670 769 | |
2. Business subsidies by industry
Around one third of direct subsidies are paid to service industries and around one third to manufacturing. By contrast, lending has centred more on service sectors and the granting of guarantees to manufacturing. The construction industry receives around four per cent of direct subsidies and three per cent of loans, but ten per cent of all guarantees. Ten per cent of direct subsidies and thirteen per cent of guarantees are granted to trade, but six per cent of loans. In primary production, the subsidy sums are small. The other industries receive eight per cent of direct subsidies and four per cent of loans and two per cent of guarantees.
The number of subsidy recipients is highest in service industries (9,706), trade (3,740) and manufacturing (3,709). The majority of manufacturing enterprises are metal industry enterprises (2,000). Subsidies have been received by 760 enterprises in primary production and by 2,354 in construction. The number of enterprises having received subsidies has not changed much from the previous year. An industry cannot be combined to a considerable share of the enterprises in the data, many of them are start-ups.
Figure 4: Shares of enterprises having received subsidies by industry in 2019
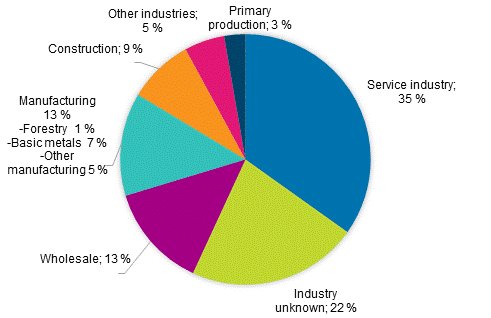
Primary production includes agriculture, forestry and fishing (TOL 2008; 01-03). Service industries include industries 49 to 82 and 90 to 96.
2.1 Direct subsidies by industry
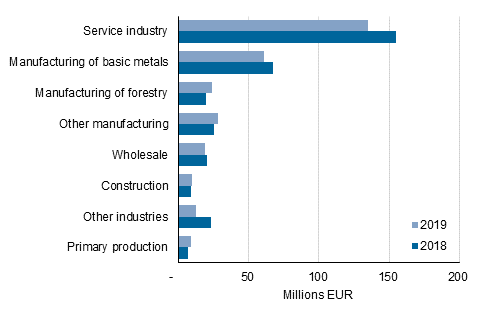
The majority of direct subsidies go to service and manufacturing enterprises. The service sector received EUR 150 million in direct subsidies and manufacturing EUR 164.6 million, of which EUR 22.6 million were directed to the forest industry, EUR 91.9 million to the metal industry and the remaining EUR 50.1 million to other manufacturing. In the forest industry, subsidies have grown relatively most, by 23.8 per cent. The amount of subsidies for service industries had fallen by 11.7 per cent from the previous year. Correspondingly, the amount of direct subsidies in trade has grown by 11.5 per cent to EUR 46.8 million. Primary production received EUR 5.7 million in subsidies, which is ten per cent less than in the year before. Subsidies for construction grew by 8.3 per cent and stood at EUR 18.1 million. Nearly EUR 52.3 million of the subsidies go to enterprises whose industry is not known.
Between 2015 and 2019, the amount of direct subsidies received by service industries has varied between EUR 140 and 170 million. Subsidies for manufacturing industries have been falling slightly. This is because the subsidies received by the metal industry have decreased. Subsidies for the forest industry have varied considerably, while those for other industries have remained stable. Subsidies for trade fell in 2016 but have been rising since then. Subsidies for other industries have varied yearly, but they have remained unchanged on average.
Figure 5: Direct subsidies by industry in 2015 to 2019
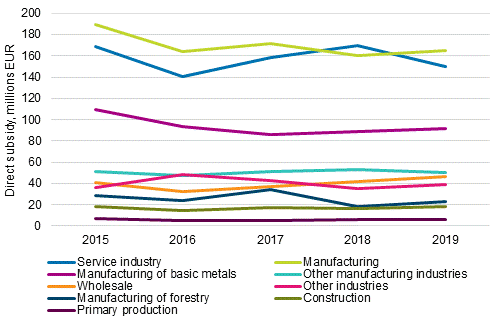
Primary production includes agriculture, forestry and fishing (TOL 2008; 01-03). Service industries include industries 49 to 82 and 90 to 96.
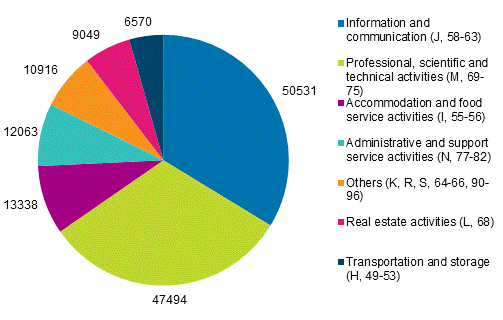
When examining service industries more closely, it can be seen that the majority of direct subsidies go to information and communication and to professional, scientific and technical activities. In 2019, subsidies for the industry of professional, scientific and technical activities amounted to EUR 47.5 million, while one year earlier it received around EUR 62 million. In other sectors, the amount of subsidies has also decreased. Only transportation, storage and real estate activities have seen an increase in the amount of subsidies. Accommodation and food service activities received EUR 13.3 million in subsidies.
Figure 6: Breakdown of paid direct subsidies by service industry in 2019, EUR thousand
2.2 Loans and guarantees by industry
The decrease in paid loans had in relative terms the biggest impact on service industries, when the amount of loans decreased by nearly EUR 20 million to EUR 134.6 million. In contrast, the amount of loans has grown in construction, primary production and other manufacturing than the metal industry. Growth was most noticeable in the forest industry, where it amounted to 22.7 per cent. The metal industry received loans to the value of EUR 60.8 million.
Figure 7: Loans received by enterprises by industry in 2018 to 2019
Primary production includes agriculture, forestry and fishing (TOL 2008; 01-03). Service industries include industries 49 to 82 and 90 to 96.
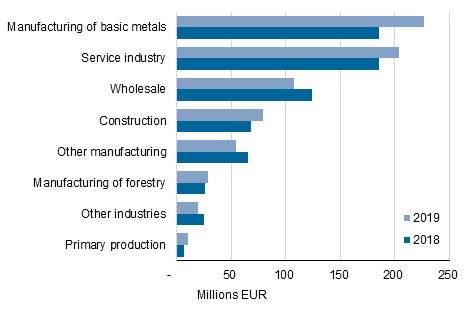
Guarantees granted to enterprises increased clearly from the previous year. In total, nearly EUR 70 million more in guarantees were granted than in 2018. Over one-half of the guarantees of EUR 806.3 million were granted to service industries and the metal industry. Guarantees for the metal industry grew by 22.3 per cent to EUR 226.6 million. Subsidies for service industries grew more moderately to EUR 203.6 million. In primary production, the forest industry and construction the amount of guarantees grew while in other industries guarantees decreased. Guarantees for trade decreased by EUR 15 million. Despite this, the trade industry received third most guarantees of all industries, in total EUR 108.1 million.
Figure 8: Guarantees granted to enterprises by industry in 2018 to 2019
Primary production includes agriculture, forestry and fishing (TOL 2008; 01-03). Service industries include industries 49 to 82 and 90 to 96.
2.3 Size of business subsidies per enterprise
Most direct subsidies per enterprise are paid to the forest industry and the metal industry. Among enterprises having received direct subsidies, the average amount of subsidies is EUR 21,600, but this varies greatly by industry. The average subsidy is EUR 92,400 in the forest industry and EUR 61,800 in the metal industry. In service industries, the size of subsidies is considerably smaller, EUR 19,900. In primary production, trade and construction, the average subsidy is even lower than this.
Of the enterprises receiving loans, the industry has a large effect on the average loan sum. In the forest industry, the average loan sum is EUR 852,500, while in construction it is EUR 88,200. The average loans granted to trade are EUR 112,400 and to service industries EUR 161,600. The breakdown of primary production is skewed: the average sum of loans is EUR 427,100 but the median is only EUR 50,000.
Guarantees per enterprise are granted considerably more to manufacturing enterprises than to enterprises in other industries. The average guarantee per enterprise having received a guarantee was EUR 437,700 in manufacturing and EUR 148,600 in service industries. The size of guarantees granted in other industries was more or less similar to those granted in service industries.
Table 3: Paid direct subsidies, loans and guarantees granted per enterprise by industry in 2019, EUR thousand
| Industry 1) | Paid direct subsidies | Paid loans | Guarantees granted |
| Primary production | 9.1 | 427.1 | 192.9 |
| Manufacturing | 58.5 | 331.8 | 437.7 |
| Manufacturing of forestry | 92.4 | 852.5 | 558.4 |
| Manufacturing of basic metals | 61.8 | 316.7 | 517.3 |
| Other manufacturing industries | 46.2 | 234.6 | 249.9 |
| Construction | 10.7 | 88.2 | 163.9 |
| Wholesale | 16.4 | 112.4 | 156.2 |
| Service industry | 19.9 | 161.6 | 148.6 |
| Other industries | 32.8 | 170.6 | 134.4 |
| Unknown industry | 8.4 | 58.6 | 95.1 |
| Total | 21.6 | 173.0 | 190.7 |
The character of business subsidies is illustrated by the fact that while the average subsidy is EUR 21,600, the median subsidy is only EUR 5,600 per enterprise. This is because the vast majority of enterprises receive fairly small subsidies, but some receive considerably larger subsidies to the tune of EUR million. Thus, the average is considerably higher than the median.
Service industries and manufacturing receive roughly the same amount of direct subsidies, but there are considerably more subsidy recipients in services. In 2019, subsidies received by both service industries and small enterprises decreased clearly. The amount of loans decreased and the amount of guarantees increased, especially in the metal industry.
3. Payment of business subsidies by month
Next, we will examine the payment dates of business subsidies by month. Most of the business subsidies granted are paid in one go. Although there is randomness in the payment date, certain trends can be seen from the data. Irrespective of the type of subsidy, most business subsidies are paid during May to June. Many subsidies are also paid at the turn of the year: direct subsidies are paid most in December and loans most in January. The least subsidies are paid in July. By quarter, direct subsidies are paid most in the fourth quarter and loans and guarantees are granted most in the second quarter. No payment date is available for the start-up grants and pay subsidies of the Ministry of Economic Affairs and Employment, so it has been estimated by the date of granting. For this reason, the results contain inaccuracy concerning the month of payment.
Figure 9: Subsidies by month in 2019, EUR million
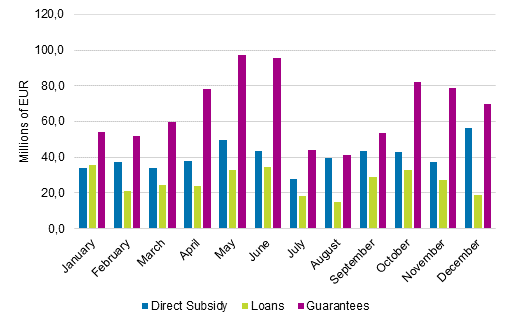
Table 4: Subsidies by month in 2019, EUR million
| Month | Direct Subsidy | Loans | Guarantees |
| January | 34.2 | 35.6 | 54.1 |
| February | 37.3 | 20.9 | 52.0 |
| March | 34.1 | 24.4 | 59.6 |
| April | 38.0 | 24.1 | 78.4 |
| May | 49.4 | 32.6 | 97.4 |
| June | 43.3 | 34.8 | 95.8 |
| July | 27.5 | 18.5 | 43.7 |
| August | 39.7 | 15.1 | 41.0 |
| September | 43.5 | 28.7 | 53.5 |
| October | 42.9 | 33.0 | 82.0 |
| November | 37.3 | 27.3 | 79.0 |
| December | 56.4 | 18.9 | 69.7 |
Source: Statistics on business subsidies, Statistics Finland
Inquiries: Tommi Veistämö 029 551 3546, tiede.teknologia@stat.fi
Director in charge: Mari Ylä-Jarkko
Updated 14.8.2020
Official Statistics of Finland (OSF):
Statistics on business subsidies [e-publication].
2019,
Significance of loans on the decline, that of guarantees growing
. Helsinki: Statistics Finland [referred: 17.7.2026].
Access method: http://stat.fi/til/yrtt/2019/yrtt_2019_2020-08-14_kat_001_en.html