Subsidies centre on small service enterprises
1. Subsidies by size category of enterprises
Direct subsidies and loans were paid and guarantees were granted to a total of 61,288 enterprises during 2020. Direct subsidies were granted to 57,875 enterprises, loans to 1,043 and guarantees to 8,152. Taking into account the enterprises to which subsidies were granted or from which subsidies were recovered, a total of 63,767 enterprises were covered by business subsidies. This is nearly 36,000 enterprises more than one year earlier. Of the subsidy recipients, 69 per cent were micro enterprises and 28 per cent small enterprises.
The amount of direct subsidies has grown irrespective of the size category of the enterprise. Direct subsidies for small enterprises grew by 368 per cent to EUR 817 million, while those for large enterprises grew the least, which after a 89 per cent growth amounted to EUR 122 million. The difference is explained by the amount of subsidies paid due to the economic downturn: nearly 80 per cent of the subsidies for micro and small enterprises were paid due to the economic downturn, while under 30 per cent of the subsidies for large enterprises were paid due to the economic downturn. Direct business subsidies totalled EUR 1,750 million, loans EUR 264 million and guarantees were granted to the amount of EUR 1,658 million.
The number of loans fell and that of guarantees grew irrespective of the enterprise size. Guarantees received by large enterprises grew to EUR 184 million from the previous year's EUR 10 million. Micro enterprises received most guarantees, EUR 389 million, small enterprises EUR 763 million and medium-size enterprises EUR 321 million. Loans to micro enterprises amounted to EUR 55 million, to small enterprises to EUR 155 million and to medium-size enterprises to EUR 49 million. Under ten per cent of the loans were paid because of the economic downturn.
Figure 1. Ordinary subsidies and subsidies paid due to the economic downturn by enterprise size category and type of subsidy quarterly in 2019 to 2020, EUR million
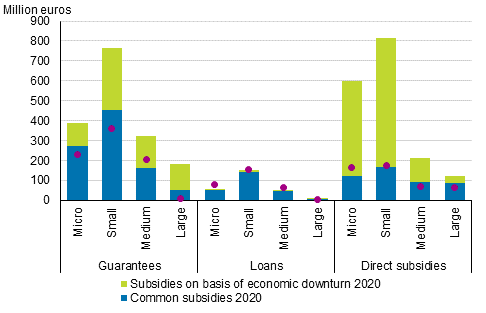
Micro enterprises: under 5 employees,
Small enterprises: 5 to 49 employees,
Medium-size enterprises: 50 to 249 employees,
Large enterprises: 250 or more
Large enterprises receive, on average, more subsidies than smaller ones. Micro enterprises received, on average, EUR 14,700 in direct subsidies per enterprise, small enterprises EUR 49,900, medium-size enterprises EUR 136,700 and large enterprises EUR 300,800. In 2019, the corresponding figures were EUR 10,700, EUR 30,500, 74,300 and 198,700, respectively, so the size of the subsidy has grown in each size category. The average loan size of micro enterprises was EUR 136,000, that of small enterprises EUR 277,000 and that of medium-size enterprises EUR 635,000. The guarantees were over EUR one million for medium-size enterprises and EUR one quarter million for small enterprises.
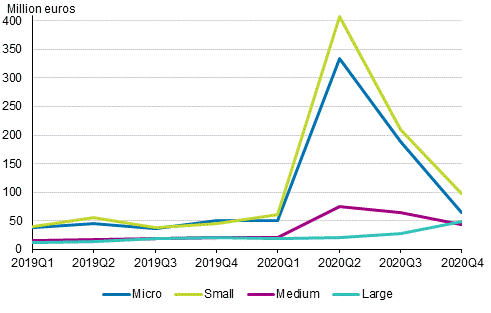
Subsidies for others than large enterprises increased significantly in the second quarter of 2020, after which quarters subsidies have declined steadily. At the end of the year, the subsidies for micro enterprises were close to the level of 2019. By contrast, subsidies for large enterprises have been rising steadily during 2020. In the early days of the pandemic large enterprises could not receive subsidies from ELY centres or Business Finland, but they were later supported with cost support.
Figure 2. Paid direct subsidies by enterprise size category and quarterly in 2019 to 2020, EUR million
Examined in the longer term, the amount of business subsidies has mainly been falling, but in 2020, an exceptionally large amount of subsidies was granted due to the COVID-19 pandemic. Only the size of the loans paid has been falling steadily: from EUR 487.6 million paid in 2015 to EUR 263.7 million paid in 2020. The drop in the amount of loans was clearest for micro enterprises, where the amount of loans has fallen by three-quarters from the level of 2015.
Table 1. Number of enterprises receiving subsidies, paid direct subsidies, loans and guarantees by size category of enterprises in 2015 to 2020, EUR thousand
| Year | Size-class of enterprise 1) | |||||
| Micro enterprises | Small enterprises | Medium-sized enterprises | Large enterprises | Total | ||
| 2020 | Number of enterprises | 43,949 | 17,651 | 1,716 | 451 | 63,767 |
| Paid direct subsidies | 597,190 | 817,420 | 213,347 | 121,537 | 1,749,494 | |
| Paid loans | 54,546 | 154,896 | 48,897 | 5,400 | 263,739 | |
| Guarantees granted | 389,134 | 763,350 | 321,175 | 183,955 | 1,657,613 | |
| 2019 | Number of enterprises | 18,778 | 7,540 | 1,165 | 365 | 27,848 |
| Paid direct subsidies | 167,042 | 174,518 | 70,254 | 64,190 | 476,004 | |
| Paid loans | 82,486 | 157,292 | 67,336 | 6,893 | 314,006 | |
| Guarantees granted | 232,191 | 360,455 | 203,737 | 9,930 | 806,312 | |
| 2018 | Number of enterprises | 18,722 | 7,969 | 1,111 | 345 | 28,147 |
| Paid direct subsidies | 150,991 | 206,300 | 66,620 | 49,708 | 473,618 | |
| Paid loans | 101,257 | 163,062 | 78,611 | 4,364 | 347,293 | |
| Guarantees granted | 181,186 | 387,499 | 156,618 | 11,625 | 736,927 | |
| 2017 | Number of enterprises | 19,132 | 7,835 | 1,092 | 353 | 28,412 |
| Paid direct subsidies | 162,412 | 186,770 | 55,232 | 78,876 | 483,290 | |
| Paid loans | 116,126 | 146,004 | 72,153 | 24,743 | 359,027 | |
| Guarantees granted | 187,662 | 356,553 | 165,358 | 4,160 | 713,734 | |
| 2016 | Number of enterprises | 16,873 | 7,484 | 1,071 | 320 | 25,748 |
| Paid direct subsidies | 147,739 | 167,466 | 58,492 | 84,986 | 458,684 | |
| Paid loans | 124,820 | 179,989 | 68,396 | 15,567 | 388,772 | |
| Guarantees granted | 195,633 | 360,927 | 171,172 | 2,350 | 730,082 | |
| 2015 | Number of enterprises | 20,129 | 8,762 | 1,188 | 374 | 30,453 |
| Paid direct subsidies | 181,866 | 190,498 | 76,945 | 85,808 | 535,117 | |
| Paid loans | 202,250 | 194,061 | 72,839 | 18,493 | 487,643 | |
| Guarantees granted | 162,489 | 350,753 | 181,017 | 26,591 | 720,849 | |
2. Business subsidies by industry
Nearly one-half of direct subsidies are paid to services and one fifth to industry. Compared to 2019, a larger share of direct subsidies goes to service industries, trade and construction, while the share of other fields has decreased. Nearly one-half of the loans are concentrated in services and 31 per cent in industry. Approximately one-third of guarantees are granted to services and one third to industry.
The number of subsidy recipients is highest in services (30,208), trade (9538) and industry (5,900). Around one-half of manufacturing enterprises are in the metal industry. There were 1,080 companies receiving support in primary production and 5,042 in construction.
Figure 3. Shares of enterprises having received subsidies by industry in 2020
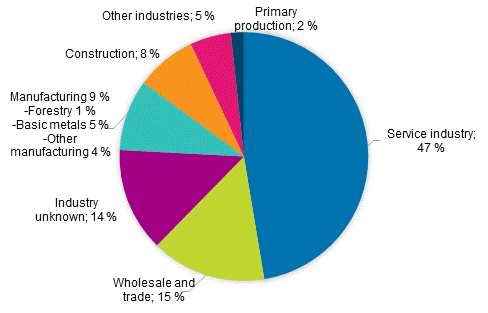
Primary production includes agriculture, forestry and fishing (TOL 2008; 01 to 03). Services include industries 49 to 82 and 90 to 96.
2.1 Direct subsidies by industry
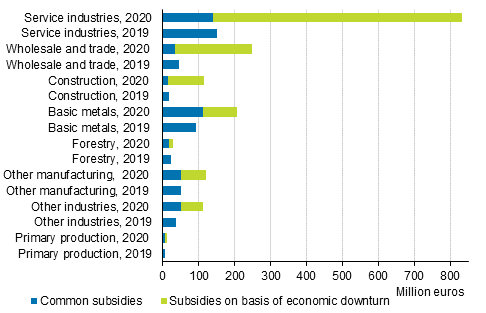
Direct subsidies paid to service industries amounted to EUR 832 million, which is five-and-a-half times more than in 2019. Subsidies in the field of trade increased by over five times to EUR 249 million. Direct subsidies to industry grew by 116 per cent and amounted to EUR 355 million, of which EUR 206 million were paid to the metal industry and EUR 29 million to the forest industry.
In relative terms, the amount of direct subsidies increased most in construction, where the amount of subsidies grew by over six times, that is, to EUR 114 million. The growth was smallest in industry and primary production, but even in primary production the subsidy sum more than doubled to EUR 13 million.
Mainly around one-half of direct subsidies were paid due to the economic downturn, but in construction, trade and services the share of direct subsidies paid due to the economic downturn was over 80 per cent. Thus, 73 per cent of total direct subsidies, or EUR 1 278 million, were paid because of the economic downturn and EUR 471 million were paid as ordinary subsidies. In 2019, direct subsidies totalled EUR 476 million, so the amount of ordinary subsidies has remained very similar.
Figure 4. Ordinary subsidies and subsidies paid due to the economic downturn by industry quarterly in 2019 to 2020, EUR million
Primary production includes agriculture, forestry and fishing (TOL 2008; 01 to 03). Services include industries 49 to 82 and 90 to 96.
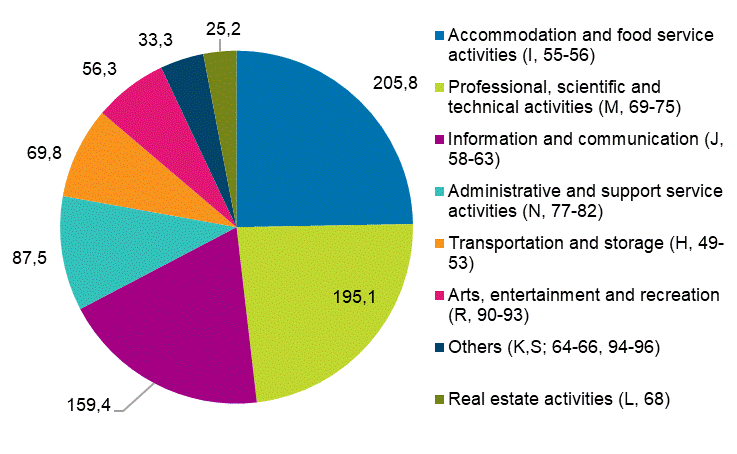
Among the services, most subsidies were paid to tourism and food service activities, which received EUR 206 million. Of this, EUR 43 million were subsidies for tourism and EUR 163 million for the food service industry. At the same time, subsidies for tourism and food service activities grew most from the year before, as in 2019 direct subsidies amounted to only EUR 13 million. Professional, scientific and technical activities, and information and communication activities received the next most subsidies. In other industries, the amount of subsidies has also increased clearly: subsidies in transportation and storage were over ten times higher and subsidies in administrative and support service activities over seven times higher. Travel agents and tour operators received EUR 21 million in direct subsidies.
Figure 5. Breakdown of paid direct subsidies in services in 2020, EUR million
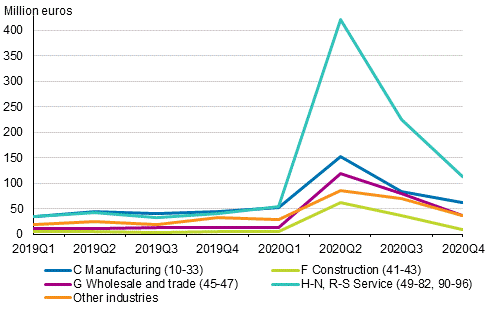
In 2019, the payment of subsidies varied by industry during the quarters, but the changes in subsidy sums were moderate compared to the change in 2020. In the second quarter of 2020, the amount of subsidies for service industries was around ten times higher than in the corresponding quarter of 2019. In general, the amount of subsidies grew considerably in each industry in the second quarter of 2020, after which the amount of subsidy has declined steadily, being in the last quarter still clearly above the usual level.
Figure 6. Subsidies paid by industry and quarter in 2019 to 2020, EUR million
2.2 Loans and guarantees by industry
The number of loans has decreased by industry and the number of guarantees has doubled from the previous year. The amount of loans decreased in services by 6 per cent to EUR 127 million. In industry, the fall of 27 per cent resulted in the total loan size of EUR 83 million. Only around eight per cent of the loans were paid due to the economic downturn.
The number of guarantees granted to enterprises grew compared with 2019 in all industries apart from the forest industry. Guarantees in industry grew by 73 per cent to EUR 538 million, in trade by 167 per cent to EUR 288 million and in services by 149 per cent to EUR 508 million. Less than one-half of guarantees were granted due to the economic downturn. Relative to this, the least guarantees were granted to the forest industry and construction, where a quarter were granted due to the economic downturn. The share of service industries, 54 per cent, was highest in all industries.
Figure 7. Guarantees granted to enterprises by industry in 2020, EUR million
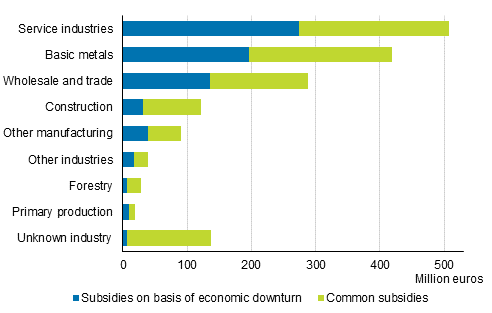
Primary production includes agriculture, forestry and fishing (TOL 2008; 01-03). Services include industries 49 to 82 and 90 to 96.
2.3 Size of business subsidies per enterprise
The amount of direct subsidies paid per enterprise has grown in all industries apart from the forest industry. The metal industry received most subsidies (EUR 78,400) per enterprise and the forest industry received almost as much. Other manufacturing industries received an average of EUR 51,500. In relative terms, the amount of subsidies per enterprise has grown most in construction, where the subsidy recipient received an average of EUR 25,700 compared with the previous year's EUR 10,700. Subsidies for service industries grew to EUR 29,000 and those for trade to EUR 28,200.
The amount of loan paid per enterprise was EUR 252,800 and that of guarantees granted EUR 202,500. In the forest industry, the average size of loans was EUR 848,400 and in primary production EUR 803,900. The average loan for other than manufacturing industries was EUR 221,800. Guarantees were granted most per enterprise to the metal industry, EUR 733,300. In the forest industry, guarantees fell to EUR 392,800. In other respects, changes from the year before were small and guarantees to others than industry were EUR 156,300, on average.
The average for direct business subsidies was EUR 30,000 and the median EUR 9,600. The corresponding figures for subsidies paid because of the economic downturn are very similar: the average was EUR 28,300 and the median EUR 10,000. The difference between the average and median is due to the fact that most enterprises receive subsidies amounting to about twenty thousand euros or less, but some enterprises receive subsidies of millions of euros, which raises the average.
3. Direct subsidies granted
The payment of the business subsidies granted may take place over several years or the subsidies are not necessarily paid in full. For these reasons, the amount of subsidies granted differs from the amount paid. The amount of subsidies paid usually follows the amount of subsidies granted at a delay of around one year and 14 to 24 per cent more subsidies were granted than paid in 2016 to 2019. EUR 588 million more subsidies were granted than were paid in 2020.
Figure 8. Direct subsidies granted and paid in 2015 to 2020, EUR million
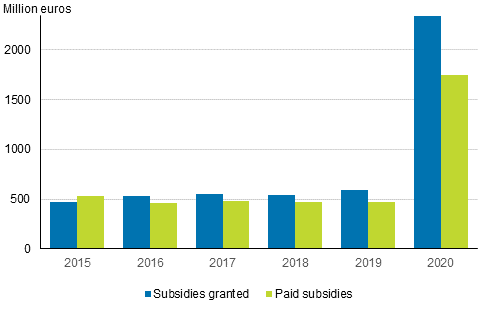
In 2020, payment of business subsidies increased strongly and, depending on the subsidy programme, they were directed at very different types of enterprises. In particular, enterprises with fewer than 50 employees received subsidies in the first half of 2020, while the focus shifted more to large enterprises in the latter half. Among the industries, especially subsidies for services, trade and construction grew strongly.
Source: Statistics on business subsidies, Statistics Finland
Inquiries: Tommi Veistämö 029 551 3546, tiede.teknologia@stat.fi
Head of Department in charge: Katri Kaaja
Updated 28.4.2021
Official Statistics of Finland (OSF):
Statistics on business subsidies [e-publication].
2020,
Subsidies centre on small service enterprises
. Helsinki: Statistics Finland [referred: 23.2.2026].
Access method: http://stat.fi/til/yrtt/2020/yrtt_2020_2021-04-28_kat_001_en.html

