Finns consume eleven times more now than 100 years ago
Present-day Finns acquire eleven times more goods and services than the Finns of the first half of the previous century. During the same period the structure of consumption has changed entirely. In the early years of Finnish independence, 88 per cent of private consumption was made up of food, beverages, tobacco, clothing, housing and housewares. Alongside the rise in the standard of living, the share of physical exercise, leisure time, travel and other expenditure has grown to nearly one half of total consumption expenditure.
From gramophone to digital set-top boxes
In the agricultural society of the previous century food, clothing and housewares were by and large home-made. Newspapers were widely read and many households subscribed to a periodical in addition to the daily newspaper. Regular radio transmissions began in 1926. Gramophones as well as popular and jazz music also became fashionable in the 1920s. The electric stove, the electric iron and the vacuum cleaner had their turn in the 1930s and the first processed foods also appeared during that decade. Going to the cinema was a popular pastime in the 1940s and 1950s.
The 1950s saw the real start of the expansion of the consumer goods markets. According to Visa Heinonen "the emergence of modern mass consumption markets in Finland in the 1950s and 1960s practically revolutionised people's lives. All Finns became more and more clearly consumers". Television transmissions began in 1957. New information and influences flowed in from abroad as television influenced people's everyday life and time use. Refrigerators and vacuum cleaners became more common and electronic domestic appliances and entertainment electronics started to appear on the market. The spread of automobiles was facilitated by the decontrol of the imports of passenger cars in 1963. Colour televisions and the stereo recorders got their turn in the 1970s, and the 1980s brought along the CD-player, the microwave oven, the waterbed and the home PC, among other things. The 1990s and the first decade of the 2000s have been an era of telecommunications with mobile phones, Internet and digital television.
Growth and setbacks
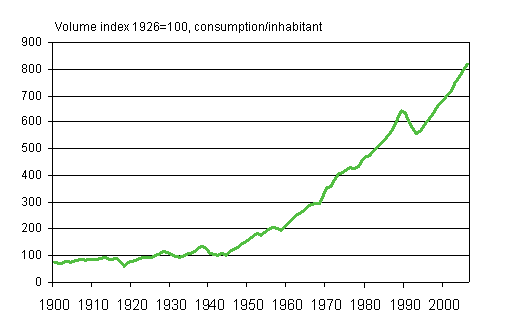
The development of private consumption during the past good one hundred years can be divided into two phases. During the first half of the previous century consumption per person doubled. During the second half of the century the growth rate accelerated, and by 2006 the volume of consumption had grown more than fivefold.
The rather stable growth in consumption expenditure in the early 20th century was interrupted by the First World War. The wave through was reached in 1918 when the volume of consumption per person was only 65 per cent of what it had been at its highest in 1913. After the war a peak in consumption was reached in 1928, but the overheating of the economy was soon followed by a global depression, which was especially trying on the agricultural population because of the fall in the prices of grain.
The deepest point of the depression was hit in 1932. As the economy revived, consumption started to grow again and a new peak was reached in 1938. Consumption per person grew by nearly 45 per cent from 1932 to 1938. The fast pace of development changed the face of consumption: in addition to radios and gramophones, the consumption of sports equipment such as baseball bats, skis and ice skates grew. The growth was cut short by the Second World War. During the war e.g. many foodstuffs, tobacco and clothing were rationed. Independent initiative increased, pigs and sheep were kept also in cities for their meat and wool. A non-smoker could exchange his/her tobacco card against points for a pair of overshoes, for instance. When the war was over, rationing was gradually lifted; the last item to be decontrolled was coffee in 1954. The 1938 level of consumption was reached again in 1948.
After the Second World War private consumption grew very rapidly. The growth was interrupted during the 1950s only by the depression which followed the expansion in demand caused by the Korean War and the recession of the years 1957 and 1958. Private consumption continued to grow strongly in the 1960s and 1970s during the great structural change and mass migration. After the mid-1970s there was a difficult period of high unemployment, during which consumption decreased slightly. Recovery took place during the economic growth of the 1980s. There was demand for labour, and even shortage of labour in some industries. The future seemed bright, housing conditions were improved and homes were equipped, often with borrowed money. By the end of the decade, consumption per person had grown by 40 per cent from the mid-1970s.
This made for a speedy entry into the 1990s - and the depression. In the worst unemployment year 1993 the unemployment rate stood at 16.3 per cent. Households' disposable income decreased, and in 1993 consumption expenditure was nearly 14 per cent lower than in 1989. Pre-depression levels were reached again only in 1998. By 2006 consumption expenditure had grown by one quarter from 1998.
Development of private consumption 1900-2006

Source: Hjerppe, Riitta (1988); Statistics Finland, National accounts
Structure of consumption changes
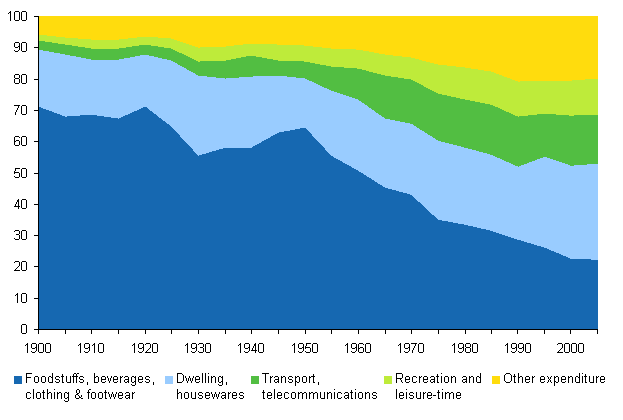
A clear transition from consumption on necessities to optional consumption can be seen in the structure of consumption. The share of food, beverages and tobacco of private consumption was roughly 60 per cent in 1900, but only a good 17 per cent in 2005. The consumption shares of meat, cheese, fruit and vegetables have grown and those of milk, butter and flour have decreased. Eating outside the home has also increased.
Expenditure on clothes per person has grown nearly ninefold and clothes are no longer made at home like in the early years of the previous century. The share of housing expenditure of private consumption has grown from 13 per cent to 25 per cent in the past century. Housing expenditure per person is over twelve times bigger now, which is significantly more than consumption on average.
The share of leisure time expenditure of all consumption has grown from 1.8 to over 11 per cent and consumption per person is over 70 times higher. Many appliances included in this group, such as radios, televisions and mobile phones, were not even known about in the beginning of the previous century. In those days one half of leisure time expenditure consisted of books, newspapers and stationery. Their share is smaller now and 85 per cent of leisure time expenditure goes to different appliances and services.
The shares of different consumption expenditure groups of total private consumption, per cent

This article is based on Liisa Tennilä's article entitled Kulutus (Consumption) in the publication Suomen vuosisata (Finland's century) from 1999 and Eino H. Laurila's publication Kulutus Suomen kansantaloudessa 1900-1975 (Consumption in the Finnish national economy). The time series of private consumption have been extended to include years 2005 and 2006 according to the figures of the national accounts.
Further information: Mr Arto Kokkinen +358 9 1734 3355, Mr Olli Pirinen +358 9 1734 3365
Sources and links
- Homepage of the national accounts
- Homepage of households' consumption statistics
- Heinonen Visa (1998) Talonpoikainen etiikka ja kulutuksen henki. Kotitalousneuvonnasta kuluttajapolitiikkaan 1900-luvun Suomessa (Peasant Ethic and the Spirit of Consumption. From Household Advising to Consumer Policy in the 20th Century Finland), Helsinki. (With an English Summary). Bibliotheca Historica33. Helsinki, Suomen Historiallinen Seura.
- Hjerppe Riitta (1988): The Finnish Economy 1860-1985. Growth and Structural Change. Bank of Finland Publications, Studies on Finland's Economic Growth 13, Government Printing Centre, Helsinki
- Laurila Eino H. (1985) Kulutus Suomen kansantaloudessa vuosina 1900-1975 (Consumption in Finnish economy in the years 1900-1975), ETLA B 42, Helsinki.
- Suomen taloushistoria 3 (1983) (Finland's economic history 3), Historical statistics, Ed. Kaarina Vattula. Helsinki.
- Tennilä Liisa (1999) Kulutus (Consumption). In Suomen vuosisata, trendit. Statistics Finland, Helsinki.
Last updated 10.7.2007
