21 April 2004
Inquiries: Mr Arto Kokkinen +358 9 1734 3355
Director in charge: Mr Ari Tyrkkö
GDP in February at the same level as in January
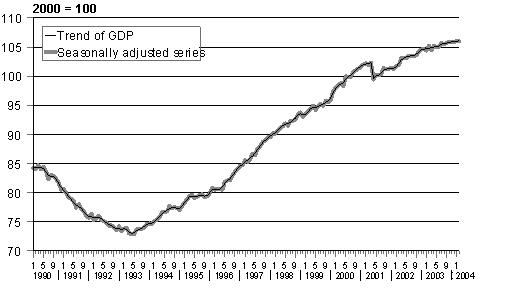
According to the seasonally adjusted series of the Monthly Indicator of GDP calculated by Statistics Finland, the volume of GDP was equal in February 2004 to that in January 2004. With the February data, the trend of GDP indicates a slightly positive direction.
Volume of GDP in 1990-2003, trend and seasonally adjusted series

Statistics Finland will take into use the Tramo/Seats seasonal adjustment method (Time Series Regression with ARIMA Noise, Missing Observations and Outliers / Signal Extraction in ARIMA Time Series) and in special cases Reg-X12-Arima in the course of 2004 and 2005. Tramo/Seats is an ARIMA model-based seasonal adjustment method derived from time series analysis in statistics science and it is the standard method used in the European Union.
The change into Tramo/Seats is first made in short-term data of national accounts. The series of the Monthly Indicator of GDP will be seasonally adjusted with the Tramo/Seats method starting from the publication 2004:02, i.e. from the data of this press release. When using the Tramo/Seats method, the change in the seasonally adjusted series and the direction of the trend are brought into view in press releases on the Monthly Indicator of GDP. Seasonal adjustments will be carried out by Tramo/Seat in quarterly national accounts from the publication I/2004 (9 June 2004) onwards.
The series adjusted for seasonal and random variation (seasonally adjusted and trend series) become revised with new observations in seasonal adjustment methods. The last three point figures should be treated cautiously because especially at the turning points new observations can change significantly the figures adjusted for seasonal and random variation. In each publication seasonal adjustments are always made from the first observation of the series to the last one, because the methods try to both estimate the trend and identify the seasonal variation within the year by examining the whole series.
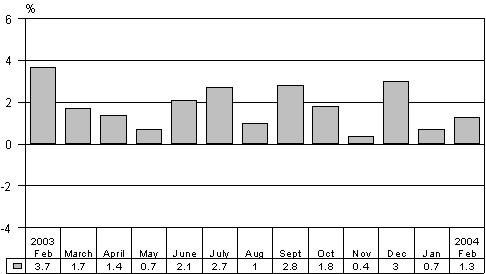
GDP grew by 1.3 per cent from February 2003
GDP increased by 1.3 per cent in February 2004 compared with last year's February. Of the six main industries of the monthly indicator, construction, trade, transport and other service industries grew, but manufacturing fell. The volume of primary production was at the same level as in February 2003.
Percentage changes of GDP from the previous year's corresponding month

Industrial output went down by 1.9 per cent from February 2003. The manufacture of electronic and electrical equipment declined by 6 per cent, and the output volume of the whole metal industry fell by 2 per cent. Output in the wood and paper industry increased by 8 per cent. Output volumes in other manufacturing decreased by 1 per cent. Energy grew by 1 per cent.
Sale volumes of trade increased by 6 per cent from February 2003. Sales of motor vehicles grew by 11 per cent and retail and wholesale trade both accelerated by 5 per cent.
The volume of primary production remained at the same level as in February 2003. The volume of fellings decreased by 2 per cent. Milk production went up by 4 per cent and meat production by 2 per cent.
Transport accelerated by 4 per cent. Output in construction grew by nearly 2 per cent. Output in other service industries was under 2 per cent higher than the year before.
The Monthly Indicator of GDP is based on twelve monthly series on different industries of the economy. The series are summed up by weighting. The purpose of the Monthly Indicator is to anticipate the development of the volume of the quarterly gross domestic product calculated later with more detailed data.
Source: Monthly Indicator of GDP 2004, February. Statistics Finland
