8 September 2004
Inquiries: Mr Tuomas Rothovius +358 9 1734
3360, kansantalous.suhdanteet@stat.fi
Director in charge: Mr Ari TyrkkŲ
GDP grew in the second quarter of the year
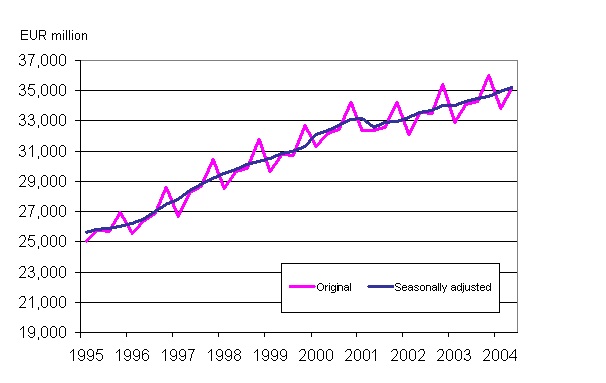
In the second quarter of 2004, the volume of Finland's gross domestic product grew by 0.7 per cent from the first quarter. Compared with the second quarter of 2003, GDP was up by 3.2 per cent. According to revised data, in the first quarter of 2004 GDP grew by 2.9 per cent from the corresponding quarter of 2003, and GDP for the first half of 2004 was 3.0 per cent up on the year before. This is indicated by the preliminary National Accounts data compiled by Statistics Finland.
GDP by quarter at 2000 prices

Household consumption and investments supported growth of the national economy. In the second quarter of 2004, households' final consumption expenditure went up by 3 per cent. Purchases of domestic appliances were plentiful, whereas those of new cars decreased. Investments grew by 6 per cent. Investments in machinery and equipment increased by 12 per cent having diminished for a couple of years prior to this. Imports were of the same magnitude as twelve months before. The volume of exports diminished by under 4 per cent; the comparison quarter of the year before included deliveries of large ships, which this year's examined quarter did not contain.
Primary production contracted by 5 per cent. Output in the service industries increased by 3 per cent and the growth in trade amounted to as much as 7 per cent. In the processing industries output went up by 4 per cent from last year. In the wood and paper industry as well as in the metal industry output grew by 5 per cent. Construction increased by 3 per cent. More dwellings but slightly fewer other buildings were built than twelve months previously.
In the second quarter of 2004, the wages and salaries bill of the national economy was 3.8 per cent greater than twelve months before. Operating surplus, which in business bookkeeping roughly corresponds to business profit and households' entrepreneurial income, grew by 9 per cent over the same time period.
The second quarter of 2004 contained one working day more than the corresponding quarter of 2003. Adjusted seasonally as well as for working days, the change in GDP from twelve months before amounted to 2.7 per cent.
According to the Flash estimate of GDP compiled by Eurostat, the Statistical Office of the European Communities, in the second quarter of 2004 GDP grew in the EU area by 0.6 per cent from the previous quarter and was 2.2 per cent up on the corresponding time period of the year before.
Demand and supply of national economy 2004, 2nd quarter, changes in volume from previous year's corresponding quarter and from previous quarter, per cent
| Change from previous year's corresponding quarter, % | Change from previous quarter, % * |
|
| Gross domestic product | +3.2 | +0.7 |
| Imports | -0.4 | +0.2 |
| Exports | -3.6 | -5.1 |
| Consumption | +2.3 | 0.0 |
| Investments | +6.4 | +2.2 |
| *Change calculated from seasonally adjusted data. | ||
Gross domestic product includes all the goods and services produced during the quarter concerned. Change in the amount, or volume, of the GDP refers to a value from which the effect of deterioration in the value of money, i.e. inflation, has been removed.
The data on the previous quarters are also checked against the newest available revised data. At the annual level, data are always revised to correspond to the latest annual accounts data. Final data are released with a time lag of approximately two years.
Change from the previous quarter is calculated from seasonally adjusted data. Seasonally adjusted GDP refers to a value from which the effect of annually occurring regular seasonal variation caused by holiday periods, seasonal weather, etc., has been removed. Seasonally adjusted series become revised as new observations become available. The data on the last quarter, in particular, should be viewed with caution, as new observations especially at turning points of economic development may alter seasonally adjusted figures significantly. The quarterly national accounts data presented here have been seasonally adjusted with the Tramo/Seats method.
Source: National Accounts 2004, 2nd quarter, Statistics Finland
Contact information:
E-mail:
