4. Costs of education and training
The costs of education and training are examined as the euro-denominated amount of money spent by the participant on education and training. Costs include participation and registration fees and study materials (books etc.) related to the education and training. It must be noted that this indicator does not take into account the differences in the available earnings of the inhabitants of various countries, and therefore, it does not measure the relative size of the contribution. For this reason, the results should not be analysed too closely, and should be considered indicative.
4.1 Costs of formal or non-formal education and training
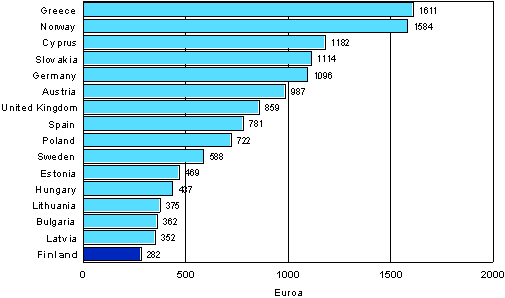
Figure 10. Expenses for formal or non-formal education and training per participant during 12 months in selected European countries over the years 2005-2007 (population aged 25-64 that participated in formal or non-formal education and training)

The youngest participants in education and training aged 25 to 34 spent more on their teaching than others in all the comparison countries except Slovakia, where persons aged 55 to 64 spent the most.
Persons with a tertiary-level degree spent more on their education and training than others (per participant) in all the comparison countries except Norway (Annex Table 7). In Norway, persons who have only completed primary-level education paid the most. In a few countries (Bulgaria, Estonia and Hungary), there was no difference in the amount spent by persons who have completed secondary and tertiary education, but those who have only completed primary education spent less on their education and training than the above-mentioned groups also in these countries.
Examined by labour market status, the comparison countries are divided into three very similar-sized groups with respect to education expenses. Among persons aged 25 to 64 living in Austria, Spain, Latvia and Slovakia who participated in formal or non-formal education and training, employed persons spent more on their education and training than others. The difference between unemployed persons and persons outside the labour force was especially large in Slovakia, where the average amount spent by employed persons on their education and training was four times that spent by others. In Germany, Greece, Hungary, Sweden and the United Kingdom, unemployed persons spent the most on their education and training - in Hungary and the United Kingdom it was even more than double that spent by others. The amount paid by persons outside the labour force was greater than that paid by employed and unemployed persons in Bulgaria, Cyprus, Lithuania and Norway. Among persons living in Estonia, persons outside the labour force and employed persons spent on average the same amount and around twice as much as unemployed persons, respectively. In Finland and Poland, labour market status did not affect the amount paid by the participant for education and training.
4.2 Costs of formal education and training
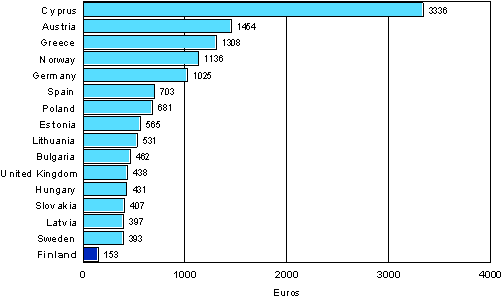
Figure 11. Cost of formal education and training per participant during 12 months in selected European countries over the years 2005-2007 (population aged 25-64 that participated in formal education and training)

There are clear differences between the comparison countries with respect to the amounts spent by participants of various ages in education and training on formal education and training (Annex Table 8). Among people living in Germany, Spain, Hungary, Latvia, Norway, Sweden and especially the United Kingdom, those in the youngest age group (persons aged 25 to 34) spent more on their education and training than those in older age groups. Participants in formal education and training aged 25 to 34 living in the United Kingdom spent three times as much money on their education and training as persons aged 35 to 54 living in the same country, and ten times as much as persons aged 55 to 64. In Austria, Bulgaria and Greece, persons aged 35 to 54 spent the most on their formal education and training, while in Cyprus, Poland and Slovakia, persons aged 55 to 64 spent the most. Only in Estonia, Finland and Lithuania were the average expenses paid by all the age groups equal.
In most of the comparison countries, persons who have a tertiary-level degree paid more than others, while persons who have only completed primary-level education paid less than others for their education and training that leads to a qualification. The exceptions are Cyprus, Estonia and Sweden, where the expenses per participant paid by persons that have completed secondary-level education were even higher, and Finland and Norway, where the amount spent in euros fell as the basic education level rose.
In Austria, Cyprus, Estonia and Slovakia, employed persons who participated in formal education and training spent more on their education and training than persons outside the labour force and unemployed persons. In Greece, Hungary and the United Kingdom, unemployed persons who participated in education and training spent the most on their education and training in relation to employed persons and persons outside the labour force. In around half of the comparison countries (including Finland), persons outside the labour force paid the most for their education and training.
4.3 Costs of non-formal education and training
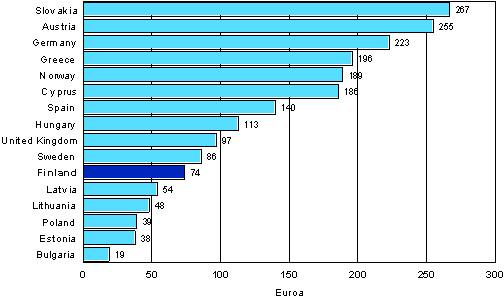
The out-of-pocket expenses per participant are clearly lower for non-formal education and training than for formal education and training. While only persons living in Finland who participated in formal education and training paid under EUR 300 for the teaching, the expenses of participants in non-formal training did not exceed EUR 300 in any of the comparison countries.
Figure 12. Expenses for non-formal education and training per participant during 12 months in selected European countries over the years 2005-2007 (population aged 25-64 that participated in non-formal education and training)

Among the persons who participated in non-formal education and training, persons aged 25 to 34 spent more on their education and training than the other age groups. The only exceptions to this were in Finland where those aged 25 to 34 and 55 to 64 paid, on average, the same, and Austria, where the age of the participant and the amount paid by the participant are not dependent on each other.
Of the people who participated in non-formal education and training, highly educated people usually spent more on teaching than others. Estonia and Norway, where persons who have only completed primary education paid the most, diverged from this pattern, as did Spain, where persons who have completed secondary-level education paid more than others for their teaching. In Cyprus and the United Kingdom, persons who have completed secondary education and persons who have tertiary-level degrees who participated in non-formal education and training paid approximately the same amount for their education and training.
Unemployed persons and persons outside the labour force who participated in non-formal education and training paid on average more than employed persons for their education and training in nearly all the comparison countries (Annex Table 9). Slovakia was the only country in which the average expenses for teaching were higher for employed persons than for unemployed persons or persons outside the labour force. In Austria, on the other hand, the average out-of-pocket expenses for education and training were almost the same for employed persons and persons outside the labour force, and higher than for unemployed persons. In half of the comparison countries (including Finland), unemployed persons participating in education and training paid more than others. In Bulgaria, Cyprus, Estonia, Norway and Poland, persons outside the labour force paid the most.
Source: EU Adult Education Survey, Eurostat
Inquiries: Timo Ruuskanen (09) 1734 3620, Irja Blomqvist (09) 1734 3221
Director in charge: Riitta Harala
Updated 24.4.2009
Official Statistics of Finland (OSF):
Participation in adult education [e-publication].
ISSN=2489-6926. European comparison 2006,
4. Costs of education and training
. Helsinki: Statistics Finland [referred: 23.2.2026].
Access method: http://stat.fi/til/aku/2006/04/aku_2006_04_2009-04-24_kat_004_en.html

