

Published: 14 January 2022
A total of 10,584 candidates in County elections 2022
Corrected on 14 February 2022. The corrections are indicated in red.
A total of 10,584 candidates were nominated in the County elections 2022. Nineteen of the registered parties nominated candidates, while the number of candidates nominated by constituency associations was 61. Of the candidates, 5,778 are men and 4,806 women. Of the candidates nominated, 111 are current Members of Parliament and 3,346 are current municipal councillors. Among the parliamentary parties, the Social Democratic Party nominated the most candidates, 1,632 candidates and the Swedish People's Party in Finland the least, 306 candidates. The data are based on Statistics Finland's statistics on the nomination of candidates for the County elections 2022.
Share of men and women among candidates by party and age in the County elections 2022, %
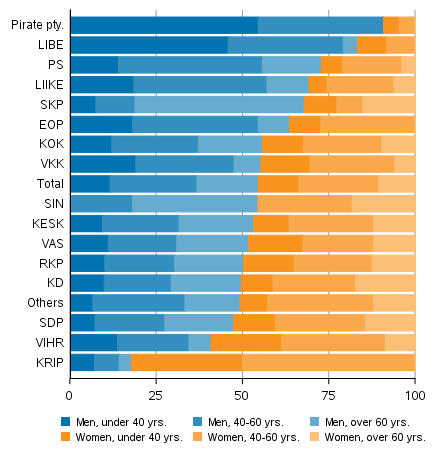
Parties with at least 10 candidates
Of the parliamentary party candidates, the proportion of female candidates is smallest for the Finns Party (27.1 per cent) and biggest for the Green League (59.1 per cent). Among all parties, the proportion of female candidates is highest in the Crystal Party (82.1 per cent) and lowest in the Pirate Party (9.1 per cent). Women make up 45.4 per cent of all candidates. In the 2022 County elections, the proportion of female candidates is clearly higher than in the 2021 Municipal elections.
The average age of all candidates is 50.3 years, that of male candidates is 51.5 and that of female ones 48.7. Of all candidates, 2,996 are aged 60 or over. A total of 366 of the candidates are aged 24 or younger. Among the parliamentary parties, the Christian Democrats have the oldest candidates, the proportion of those aged 60 or over is 37.5 per cent and the average age 53. Among the parliamentary parties, the Green League has the youngest candidates, 34.2 per cent of whom are aged under 40 and the average age 45.1 years.
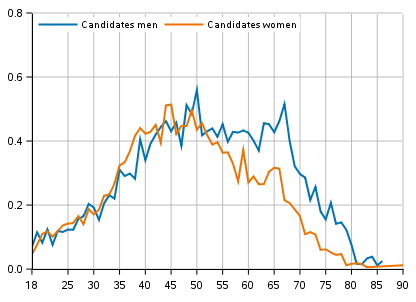
Three men and 2.4 women per one thousand men/women entitled to vote have been nominated as candidates. In the Municipal elections, women's candidacy has been lower than men's in all age groups. In the 2022 County elections, up to the age of 50, the proportion of female candidates is higher than that of men in nearly all age groups.
Share of candidates in the age group by sex in the County elections 2022, %
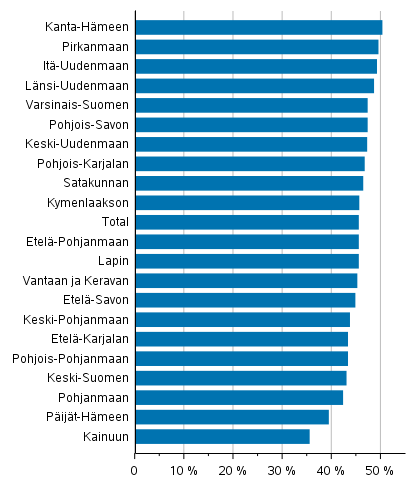
In relative terms, the number of female candidates is highest in Kanta-H�me (50.2%). Clearly fewer female candidates than in the other areas are nominated in Kainuu and P�ij�t-H�me, under 40 per cent of the candidates.
Women’s share of candidates by wellbeing services county in the County elections 2022, %
Eighty per cent of all candidates nominated by the parties were also candidates in the 2021 Municipal elections. Among the parliamentary parties, the Finns Party has the highest number of the same candidates, nearly 95 per cent were also candidates in the Municipal elections. The proportion of candidates who also ran in the Municipal elections is lowest for the Movement Now party, slightly over 50 per cent. Most of the candidates nominated by the parties were nominated by the same party in the 2021 Municipal elections.
The number of foreign-language speakers, that is, persons not speaking Finnish, Swedish or Sami as their native language, is clearly lower among the candidates than among persons entitled to vote. Slightly over six per cent of the persons entitled to vote are foreign-language speakers, while this is so for 2.2 per cent of the candidates. Among the parliamentary parties, the Green League (4.0%) and the Christian Democrats (3.4%) have most foreign-language speaking candidates. In the group outside the parliamentary parties, the proportion of foreign-language speakers is bigger than average (3.8%). The proportion of foreign-language speaking candidates is lowest among the Finns Party (1.2%) and Movement Now (1.2%).
Foreign-language speakers’ proportion of persons entitled to vote and candidates (by party) in the County elections 2022, %

There are citizens of 27 different countries among the candidates. Slightly over four per cent of all persons entitled to vote are foreign citizens. Of the candidates, 66 are foreign citizens. There are 163 (1.5%) candidates that are Finnish citizens with citizenship in another country as well. Among all persons entitled to vote, 2.1 per cent have dual citizenship.
Over 93 per cent of the candidates have completed post-basic level education and slightly over 76 per cent of persons entitled to vote have done so. This is partly explained by the different age structure of people entitled to vote and the candidates. Among the parliamentary parties, the educational level is highest for the Green League candidates, nearly 68 per cent of whom have tertiary level education. Forty-seven per cent of all candidates and 23 per cent of all persons entitled to vote have completed a qualification on that level. The Swedish People's Party and Coalition Party candidates are also more highly educated than average, 63.7 per cent of the Swedish People's Party candidates and 60.0 per cent of the Coalition Party candidates have tertiary level education.
Persons entitled to vote, candidates (by party) by educational level in the County elections 2022, %
| Basic level |
Upper secondary level |
Lowest level tertiary |
Lower- degree tertiary |
Higher- degree level tertiary, doctorate |
|
| Persons ent. to vote |
23.8 | 44.2 | 9.5 | 12.2 | 10.3 |
| Candidates | 6.6 | 34.7 | 11.7 | 18.7 | 28.3 |
| SDP | 5.8 | 38.5 | 12.9 | 18.6 | 24.2 |
| PS | 11.1 | 51.1 | 10.9 | 14.9 | 12.0 |
| KOK | 4.6 | 22.3 | 13.0 | 18.4 | 41.6 |
| KESK | 4.6 | 28.2 | 16.1 | 18.6 | 32.5 |
| VIHR | 4.8 | 23.1 | 4.6 | 22.7 | 44.8 |
| VAS | 7.5 | 43.5 | 8.4 | 20.5 | 20.0 |
| RKP | 3.9 | 19.0 | 13.4 | 23.5 | 40.2 |
| KD | 6.7 | 31.1 | 13.5 | 18.1 | 30.7 |
| LIIKE | 9.0 | 42.6 | 11.0 | 21.7 | 15.7 |
| Others | 9.8 | 47.1 | 11.1 | 15.8 | 16.2 |
In all, 70 per cent of the candidates were employed and around seven per cent were unemployed at the end of 2020. Around one-half of persons entitled to vote were employed and 7.6 per cent were unemployed. Clearly fewer of the candidates were pensioners (around 17%) than among persons entitled to vote. Around one third of persons entitled to vote were pensioners. The employment rate is calculated as the share of employed persons in working-age population aged 18 to 64.
Persons entitled to vote and candidates (by party) by main type of activity in the County elections 2022, %
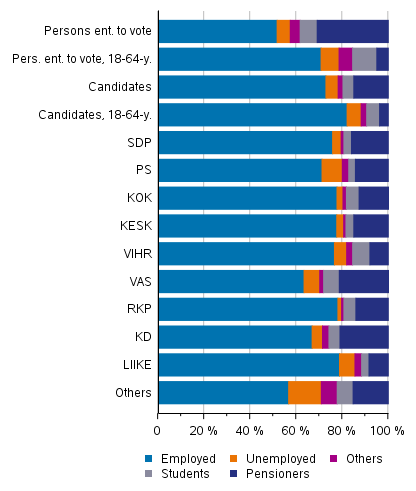
Of all candidates aged 18 to 64, altogether 80.4 per cent are employed. The employment rate for persons entitled to vote aged 18 to 64 is 11.6 percentage points lower. The difference between the employment rates of the candidates and persons entitled to vote is smallest in Ostrobothnia, where the employment rate of the candidates is 6.6 percentage points higher. The difference is biggest in North Savo, where the employment rate of the candidates is 83.4 per cent and that of persons entitled to vote 67.6 per cent.
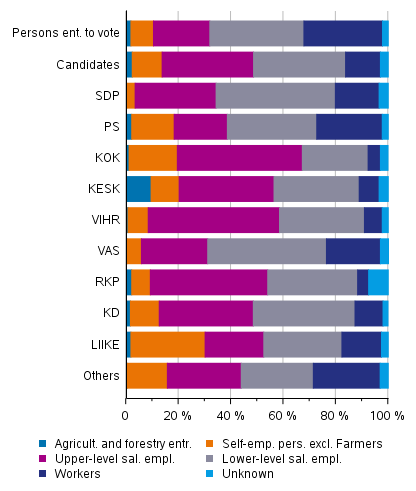
More candidates are self-employed persons (incl. farmers and forestry entrepreneurs) than persons entitled to vote. The share of self-employed persons is around 14 per cent among employed candidates and slightly over 10 per cent among persons entitled to vote. Among the parliamentary parties, the highest proportion of self-employed persons is found among Movement Now candidates (30.2%) and the second highest among Centre Party candidates (20.2%), of whom around one half are farmers and forestry entrepreneurs.
Persons entitled to vote and candidates (by party) by socio-economic group in the County elections 2022, %
The median disposable income of persons entitled to vote was EUR 22,300 in 2020, while that of candidates was EUR 30,900. The candidates' disposable income is, on average, 39 per cent higher than that of persons entitled to vote. Disposable income is highest in the wellbeing services county of West Uusimaa both for persons entitled to vote (EUR 25,900 per year) and for candidates (EUR 34,500 per year). Disposable monetary income refers to the monetary income after taxes that consists of earned income, property income, and transfer income.
In euros, the income differential between the candidates and persons entitled to vote is largest in the wellbeing services counties of South and North Savo, where the median disposable income of the candidates is over EUR 10,000 higher than that of persons entitled to vote. Income differentials are smallest in the wellbeing services counties of Central Ostrobothnia and Central Uusimaa, under EUR 8,000.
Median disposable income (EUR per year) of persons entitled to vote and candidates by wellbeing services county in the County elections 2022
| Persons entit. to vote |
Candidates | |||||
| Total | Male | Female | Total | Male | Female | |
| Total | 22,300 | 24,200 | 20,800 | 30,900 | 31,600 | 30,300 |
| It�- Uudenmaan |
24,600 | 27,000 | 22,600 | 32,700 | 34,600 | 30,300 |
| Keski- Uudenmaan |
25,500 | 27,900 | 23,300 | 33,400 | 34,500 | 32,400 |
| L�nsi- Uudenmaan |
25,900 | 28,300 | 24,100 | 34,500 | 35,900 | 33,100 |
| Vantaan ja Keravan |
24,500 | 26,500 | 22,900 | 32,600 | 34,500 | 31,700 |
| Varsinais- Suomen |
22,100 | 24,000 | 20,700 | 30,100 | 30,700 | 29,800 |
| Satakunnan | 21,400 | 23,500 | 19,900 | 30,700 | 30,600 | 30,900 |
| Kanta- H�meen |
22,400 | 24,400 | 20,800 | 32,300 | 32,800 | 32,100 |
| Pirkanmaan | 21,900 | 24,000 | 20,400 | 30,800 | 31,600 | 30,000 |
| P�ij�t- H�meen |
21,400 | 23,400 | 20,000 | 30,500 | 31,400 | 29,900 |
| Kymenlaakson | 21,400 | 23,700 | 19,600 | 30,200 | 31,600 | 28,700 |
| Etel�- Karjalan |
21,000 | 23,100 | 19,400 | 30,700 | 31,800 | 29,500 |
| Etel�- Savon |
20,200 | 21,500 | 19,300 | 30,800 | 30,800 | 31,000 |
| Pohjois- Savon |
21,100 | 22,600 | 20,000 | 31,500 | 32,500 | 30,500 |
| Pohjois- Karjalan |
19,700 | 20,800 | 18,900 | 28,000 | 27,900 | 28,000 |
| Keski- Suomen |
21,000 | 22,900 | 19,600 | 29,800 | 30,400 | 29,200 |
| Etel�- Pohjanmaan |
21,300 | 22,900 | 20,100 | 31,100 | 31,200 | 30,600 |
| Pohjanmaan | 22,200 | 24,500 | 20,400 | 30,700 | 32,500 | 28,300 |
| Keski- Pohjanmaan |
21,800 | 24,100 | 20,000 | 29,600 | 30,300 | 28,000 |
| Pohjois- Pohjanmaan |
22,000 | 23,800 | 20,600 | 30,700 | 31,300 | 30,000 |
| Kainuun | 20,800 | 22,200 | 19,700 | 29,400 | 29,900 | 28,500 |
| Lapin | 21,600 | 23,000 | 20,500 | 30,200 | 30,700 | 29,500 |
The national register of candidates is published on the web pages of the Ministry of Justice ( www.vaalit.fi ).
Source: County Elections 2022, nomination of candidates. Statistics Finland
Inquiries: Sami Fredriksson 029 551 2696, Kaija Ruotsalainen 029 551 3599, Jaana Asikainen 029 551 3506, vaalit@stat.fi
Head of Department in charge: Hannele Orjala
Publication in pdf-format (536.3 kB)
- Tables
-
Tables in databases
Pick the data you need into tables, view the data as graphs, or download the data for your use.
Appendix tables
- Appendix table 1. Persons entitled to vote and candidates by native language (largest language groups) in the County elections 2022, % (14.1.2022)
- Appendix table 2. Employment rate of persons entitled to vote and candidates (aged 18 to 64) by sex and by wellbeing services county in the County elections 2022, % (Appendix table was corrected on 14 February 2022.) (14.1.2022)
- Appendix table 3. Background analysis of candidates by party in the County elections 2022 (14.1.2022)
- Figures
- Quality descriptions
-
- County elections, quality description (14.1.2022)
Updated 14.01.2022
Statistics:
County elections [e-publication].
01 2022. Helsinki: Statistics Finland [referred: 21.7.2026].
Access method: http://stat.fi/til/alvaa/2022/01/alvaa_2022_01_2022-01-14_tie_001_en.html