Published: 23 December 2019
Significant growth in the number of personnel in service industries in 2018
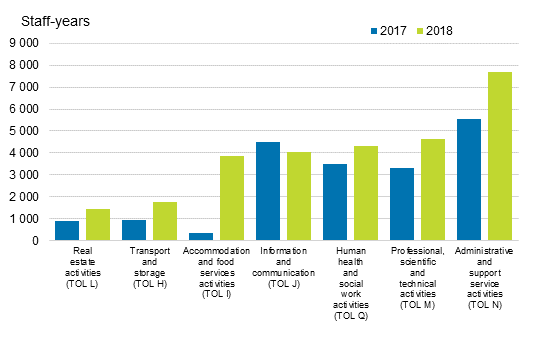
Finland had 395,000 establishments where 1.5 million staff-years were worked in 2018. The number of personnel increased clearly from 2017, by as much as 45,000. Over one-half of the increase came from service industry (TOL H to S) establishments. These data derive from Statistics Finland's regional statistics on entrepreneurial activity.
Increase in number of personnel in service industries in 2017 to 2018

Some 360,000 enterprises operated in Finland in 2018. The enterprises had a total of 395,000 establishments. A majority of the enterprises, or 354,000, had only one establishment. The remaining enterprises, some 7,000, were multi-establishment enterprises with an average of six establishments per enterprise.
Of the 1.5 million staff-years performed in the establishments, around 800,000 were carried out in the largest cities 1) . In total, 186,000 establishments were located in these regions. Of the growth in personnel in the service industries, 30,000 or nearly 70 per cent materialised in these establishments. Four staff-years on average were carried out at one establishment in the largest cities.
Turnover growth slowed down in construction in 2018
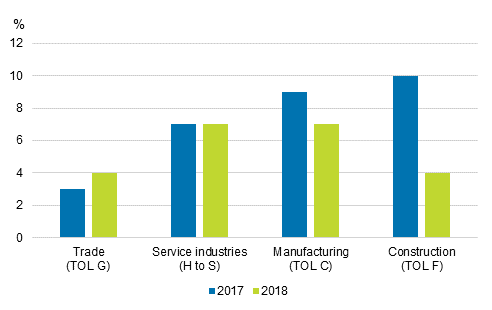
The combined turnover of establishments was EUR 436 billion. Turnover grew by EUR 25 billion or six per cent year-on-year. Growth occurred in nearly all main industries but in some the growth rate slowed down from 2017. The biggest slowdown in turnover growth was seen in construction. Trade sales, in turn, grew better than in the year before.
Turnover growth percentages by industry in 2017 to 2018

Turnover grew in all other regions apart from Åland. In addition to the regions in which the largest cities are located, Kymenlaakso, Central Finland and North Ostrobothnia reached over EUR one billion growth in turnover. In the other regions, growth varied between EUR 200 and 800 million.
Output grew, topped by three industries in 2018
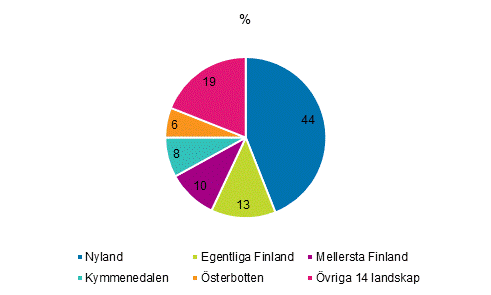
The combined gross value of output of establishments was EUR 325 billion. Output grew by 15 billion or five per cent year-on-year. Growth was recorded in all main industries, most in manufacturing, seven billion. A majority of growth in manufacturing was achieved in southern regions with the help of three industries:
Manufacture of paper and paper products (TOL 17)
Manufacture of coke and refined petroleum products (TOL 19)
Manufacture of machinery and equipment n.e.c. (TOL 28)
2)
Distribution of growth in the gross value of output in three industries (TOL 17,19 and 28) by region in 2018

Efficiency in trade improved in 2018
After excluding production costs from the gross value of output, the value added of establishments totalled EUR 114 billion. Value added increased by EUR four billion from 2017, i.e. by three per cent.
The value added measures the total value added produced by the various factors of production in an establishment’s actual operating activities. Growth in value added calculated per person usually indicates better profitability and efficiency in operations.
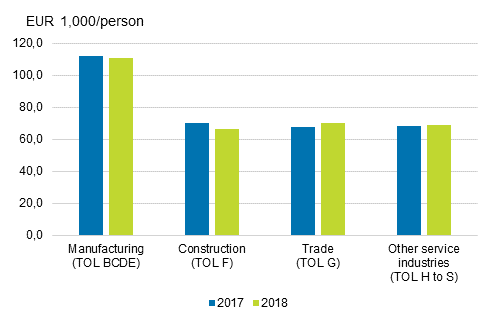
Value added per person by industry shows better efficiency in trade than in 2017. According to financial statement data 3) , the profitability of trade measured by operating margin was at the same level as in 2017.
Value added by person in 2017 to 2018

The efficiency indicators in total industries (BCDE) and construction (TOL F) weakened from the year before due to weaker value added. The value added in total industries was depressed by manufacture of computer, electronic and optical products (TOL 26), and in construction by construction of buildings (TOL 41) and civil engineering (TOL 43). The gross margin coefficients in manufacturing and construction were weaker than in 2017.
1) Uusimaa, Southwest Finland and Pirkanmaa
2) E.g. manufacture of lifting and handling equipment, and mining, quarrying and construction machinery.
3) Structural business and financial statement statistics
Source: Regional statistics on entrepreneurial activity 2018, Statistics Finland
Inquiries: Merja Kiljunen 029 551 3284, rakenne.tilastot@stat.fi
Director in charge: Mari Ylä-Jarkko
Publication in pdf-format (236.3 kB)
- Tables
-
Tables in databases
Pick the data you need into tables, view the data as graphs, or download the data for your use.
Appendix tables
Updated 23.12.2019
Official Statistics of Finland (OSF):
Regional statistics on entrepreneurial activity [e-publication].
ISSN=2342-6268. 2018. Helsinki: Statistics Finland [referred: 4.2.2026].
Access method: http://stat.fi/til/alyr/2018/alyr_2018_2019-12-23_tie_001_en.html

