Published: 31 January 2020
Prices of new dwellings in housing companies have risen compared to 2015 most in Espoo, least in Vantaa
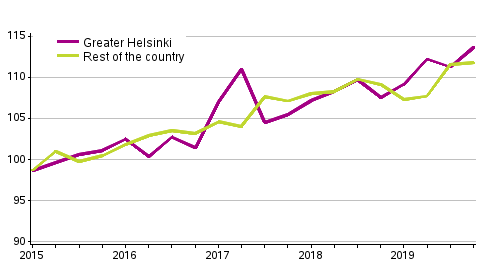
Prices of new dwellings in housing companies rose last year by 1.9 per cent from 2018. In Greater Helsinki, prices went up by around three per cent and in the rest of the country by nearly one per cent. These data derive from the revised statistics on prices of new dwellings in housing companies
Development of prices of new dwellings in housing companies by quarter, index 2015=100

In the last quarter of 2019, prices rose in Greater Helsinki by 5.7 per cent from the corresponding period of 2018 and in the rest of Finland by 2.4 per cent. Compared to the third quarter, they rose in Greater Helsinki by 2.1 per cent and remained unchanged elsewhere in Finland.
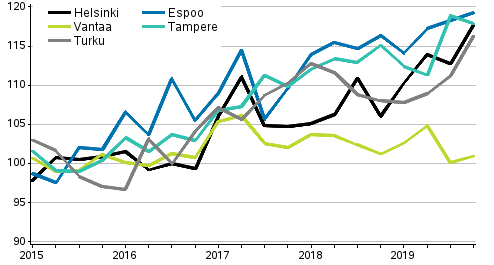
Compared to 2015, prices of new dwellings have risen on average by a little over 10 per cent in the whole country. Of large towns, prices have risen particularly in Espoo, by 17 per cent. Prices have gone up by 10 to 15 per cent in Helsinki, Tampere and Turku. In Vantaa, the prices have remained almost unchanged.
Development of prices of new dwellings in housing companies quarterly in large towns, index 2015=100

The average price per square metre for a new one-bedroom dwelling in a block of flats located on own plot was EUR 7,452 in Helsinki, EUR 4,769 in Tampere and EUR 4,992 in Turku. The average price per square metre for a new one-bedroom dwelling located on rented plot was EUR 6,044 in Helsinki, EUR 4,334 in Tampere and EUR 3,978 in Turku.
Prices of new dwellings, 2019
| Area | Index 2015=100 | Yearly change, % | Price, EUR/m² of new one-bedroom dwellings in block of flats on own plot | Price, EUR/m² of new one-bedroom dwellings in block of flats on own plot on rented plot |
| Whole country | 110.5 | 1.9 | 5,096 | 4,327 |
| Greater Helsinki | 111.6 | 3.1 | 6,517 | 5,213 |
| Rest of the country (whole country- Greater Helsinki) | 109.6 | 0.7 | 4,197 | 3,842 |
| Helsinki | 113.6 | 6.1 | 7,452 | 6,044 |
| Espoo-Kauniainen | 117.6 | 2.2 | 6,185 | 4,916 |
| Vantaa | 102.1 | -0.6 | 4,896 | 4,049 |
| Tampere | 115.1 | 1.5 | 4,769 | 4,334 |
| Turku | 111.0 | 0.6 | 4,992 | 3,978 |
| Jyväskylä | 110.5 | 1.3 | 4,182 | . |
| Oulu | 109.5 | -3.5 | 3,909 | 3,345 |
The data on new dwellings in blocks of flats are based on information on the transaction prices of the largest building contractors and estate agents. More information is available on changes in the statistics on new dwellings in housing companies and their results in the Tieto&trendit blog and article (in Finnish) to appear on 31 January 2020 and in the section on changes in these statistics. More detailed price data on dwellings in housing companies are available at stat.fi/til/ashi/tau_en.html.
Price data for old dwellings in housing companies are not published for the time being.
Source: Prices of dwellings in housing companies, Statistics Finland
Inquiries: Elina Vuorio 029 551 3385, Johanna Vuorio 029 551 3012, asuminen.hinnat@stat.fi
Director in charge: Mari Ylä-Jarkko
Publication in pdf-format (320.2 kB)
- Tables
-
Tables in databases
Pick the data you need into tables, view the data as graphs, or download the data for your use.
- Quality descriptions
Updated 31.1.2020
Official Statistics of Finland (OSF):
Prices of dwellings in housing companies [e-publication].
ISSN=2323-8801. December 2019. Helsinki: Statistics Finland [referred: 22.2.2026].
Access method: http://stat.fi/til/ashi/2019/12/ashi_2019_12_2020-01-31_tie_001_en.html

