Published: 5 May 2020
Prices of old dwellings in housing companies unchanged in March compared with the early part of the year
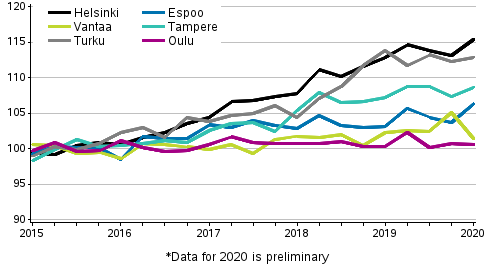
According to Statistics Finland's monthly-level preliminary data, prices of old dwellings in housing companies have remained on level with January to February both in greater Helsinki and elsewhere in Finland in March 2020. Compared with the corresponding period of the year before, prices rose by 1.3 per cent in Greater Helsinki and fell somewhat elsewhere in Finland.
Development of prices of old dwellings in housing companies by month, index 2015=100

Based on the Tax Administration's Asset Transfer Tax data for March, not much can yet be said about the effects of the corona pandemic on the numbers of transactions of old dwellings, because the data will become revised in the following releases.
Based on transactions made through real estate agents, around two per cent more transactions of old dwellings were made in March compared with the corresponding period last year. In February 2020, around 10 per cent more transactions were made than in the corresponding period of one year ago. Data on transactions made through real estate agents will in future be published in Statfin-table, monthly data.
Prices of old dwellings in housing companies rose in Greater Helsinki in the first quarter and fell slightly in the rest of the country
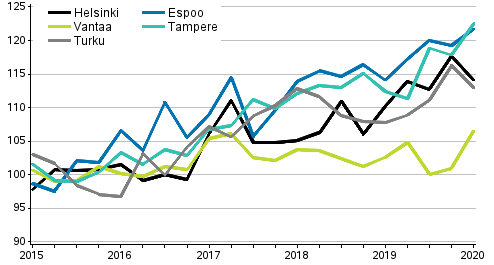
According to preliminary data, prices of old dwellings in housing companies rose by two per cent in Greater Helsinki in the first quarter of 2020 from the corresponding quarter of the year before. Prices fell slightly in the rest of Finland. Compared with the previous quarter, prices rose by around 1.5 per cent both in Greater Helsinki and in the rest of Finland.
Among large towns, prices of old dwellings in housing companies rose most clearly compared with the corresponding period of last year in Helsinki and Espoo. The average price per square metre of a one-bedroom dwelling in an old block of flats was EUR 4,702 in Helsinki, EUR 3,548 in Espoo and EUR 2,139 in Turku in the first quarter of the year.
Development of prices of old dwellings in housing companies quarterly, index 2015=100

Prices of new dwellings in housing companies rose in the first quarter
Compared with the corresponding period in 2019, prices of new dwellings rose by 3.9 per cent in Greater Helsinki and by 5.6 per cent elsewhere in Finland. Compared with the previous quarter, prices of new dwellings remained unchanged in Greater Helsinki and rose by 1.4 per cent in the rest of Finland. Compared with the previous year, prices of new dwellings rose in all large towns.
Development of prices of new dwellings in housing companies quarterly, index 2015=100

Old dwellings in housing companies sold well towards the end of the year
According to the Tax Administration's asset transfer tax data, about 63,300 transactions of old dwellings in housing companies were completed last year, which is slightly more than in 2018. Transactions of dwellings were particularly abundant towards the end of the year.
According to final data, prices of old dwellings in blocks of flats and terraced houses rose slightly in the whole of 2019. In Greater Helsinki, prices rose by over two per cent and in the rest of the country they fell by about one per cent.
Data on prices of dwellings in housing companies in different areas and by house type are available at stat.fi/til/ashi/tau_en.html. The tables also contain data on the prices per square metre at the municipal and postal code levels and on the numbers of transactions in 2019.
Prices of old dwellings in housing companies, whole year 2019, final data
| Area | Price, EUR/m² | Index 2015=100 | Yearly change, % |
| Whole country | 2,077 | 103.2 | 0.7 |
| Greater Helsinki | 3,719 | 110.0 | 2.4 |
| Rest of the country (whole country- Greater Helsinki) | 1,595 | 97.1 | -1.1 |
| Helsinki | 4,323 | 113.6 | 3.1 |
| Helsinki 1 1) | 7,345 | 119.5 | 4.3 |
| Helsinki 2 | 5,592 | 116.9 | 3.9 |
| Helsinki 3 | 3,749 | 109.4 | 2.5 |
| Helsinki 4 | 2,907 | 106.2 | 1.0 |
| Tampere | 2,503 | 108.1 | 1.3 |
| Tampere 1 | 3,445 | 115.6 | 2.8 |
| Tampere 2 | 2,456 | 103.2 | 1.2 |
| Tampere 3 | 1,994 | 102.8 | -0.3 |
| Turku | 2,112 | 112.8 | 4.4 |
| Turku 1 | 3,182 | 120.3 | 6.7 |
| Turku 2 | 2,244 | 107.8 | 0.2 |
| Turku 3 | 1,547 | 106.0 | 3.2 |
| Kuopio | 1,752 | 89.5 | -4.7 |
| Mikkelii | 1,582 | 91.9 | -2.0 |
| Kokkola | 1,707 | 86.9 | -4.5 |
| Vaasa | : 1,695 | 90.2 | -4.3 |
Starting from March 2020, the data used in the statistics on prices of old dwellings in housing companies are the Tax Administration's data on dwellings (data on ownership of dwellings in housing companies) and starting from 2019, the price data have been calculated from the data on dwellings. To improve comparability, the numbers have been recalculated from the Tax Administration's data on dwellings in housing companies for 2006 to 2018.
The data on new dwellings in housing companies are based on information on the transaction prices reported by the largest building contractors and real estate agents. The numbers of old dwellings in housing companies sold through real estate agents are based on the price monitoring service of the Central Federation of Finnish Real Estate Agencies.
Source: Prices of dwellings in housing companies, Statistics Finland
Inquiries: Petri Kettunen 029 551 3558, Elina Vuorio 029 551 3385, asuminen.hinnat@stat.fi
Director in charge: Mari Ylä-Jarkko
Publication in pdf-format (442.4 kB)
- Tables
-
Tables in databases
Pick the data you need into tables, view the data as graphs, or download the data for your use.
Appendix tables
- Appendix table 1. Prices per square metre of old dwellings in housing companies, March 2020 1) (5.5.2020)
- Appendix table 2. Unencumbered average prices per square metre of old blocks of flats, March 2020 1) (5.5.2020)
- Appendix table 3. Unencumbered average prices per square metre of old terraced houses, March 2020 1) (5.5.2020)
- Figures
-
- Appendix figure 1. Average prices per square meter of dwellings in old blocks of flats (5.5.2020)
- Appendix figure 2. Average prices per square meter of dwellings in old terraced houses (5.5.2020)
- Appendix figure 3. Price development of old dwellings in blocks of flats in Helsinki Metropolitan Area, index 2015=100 (5.5.2020)
- Appendix figure 4. Price development of old dwellings in blocks of flats in Tampere, Turku, Oulu and Kajaani, index 2015=100 (5.5.2020)
- Appendix figure 5. Real Price Index of old dwellings in blocks of flats, index 1970=100 (5.5.2020)
- Quality descriptions
- Revisions in these statistics
-
- Revisions in these statistics (5.5.2020)
Updated 5.5.2020
Official Statistics of Finland (OSF):
Prices of dwellings in housing companies [e-publication].
ISSN=2323-8801. March 2020. Helsinki: Statistics Finland [referred: 16.12.2025].
Access method: http://stat.fi/til/ashi/2020/03/ashi_2020_03_2020-05-05_tie_001_en.html

