Published: 13 December 2012
Total energy consumption fell by 5 per cent in 2011
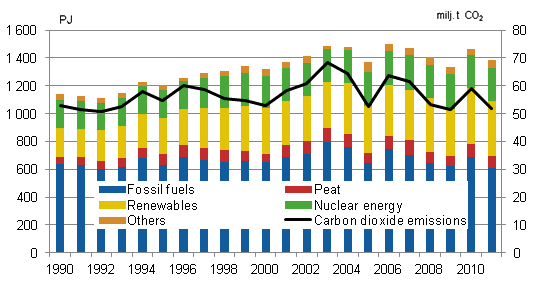
According to Statistics Finland, total consumption of energy in Finland amounted to 1.39 million terajoules (TJ) in 2011, which was five per cent less than in 2010. Four per cent less electricity was used than in the previous year, totalling 84.2 terawatt hours (TWh). The use of renewable energy sources decreased by one per cent and that of fossil fuels by 12 per cent. Carbon dioxide emissions from the production and use of energy fell by 12 per cent from 2010 and amounted to 51.7 tonnes of carbon dioxide.
Total energy consumption and carbon dioxide emissions 1990–2011

The share of renewable energy of total energy consumption increased and stood at 28 per cent. EU targets for renewable energy are calculated relative to final energy consumption and in Finland this share has been four to five percentage points higher than the share calculated from total energy consumption. Finland's target for the share of renewable energy is 38 per cent of final energy consumption in 2020.
Total energy consumption 2010–2011, terajoule
| 2011 | 2010 | Change % | |
| Oil | 333 522 | 353 301 | -6 |
| Wood fuels | 316 291 | 321 406 | -2 |
| Nuclear energy | 242 897 | 238 789 | 2 |
| Coal | 148 337 | 189 059 | -22 |
| Natural gas | 130 032 | 148 680 | -13 |
| Peat | 84 938 | 94 545 | -10 |
| Hydro power | 44 202 | 45 875 | -4 |
| Net imports of electricity | 49 863 | 37 802 | 32 |
| Wind power | 1 733 | 1 060 | 64 |
| Others | 36 182 | 35 734 | 1 |
| Total | 1 387 997 | 1 466 250 | -5 |
The use of fossil fuels went down by 12 per cent from the year before. Of fossil fuels, the consumption of coal (including hard coal, coke, and blast furnace and coke oven gas) decreased by 22 per cent. The use of coal diminished significantly in separate production of condensing power. The use of natural gas fell by 13 per cent and the use of peat by ten per cent.
The weakened water situation in the other Nordic countries improved in 2011. The production of water power decreased by four per cent in Finland. The production of wind power increased by 64 per cent, but it still accounted for only 0.7 per cent of all electricity produced.
Production of nuclear power grew by two per cent from the previous year. In all, 32 per cent of Finland's electricity production was covered by nuclear energy.
Imports of electricity increased by 12 per cent and net imports of electricity increased by 32 per cent. The largest amount of electricity was imported from Russia, from where imports amounted to 10.8 TWh. Finland was a net buyer on the Nordic electricity market. Altogether, 27 per cent less electricity was exported than in the previous year, as exports to Sweden, in particular, decreased notably. Electricity exports to Sweden was depressed by the improved water situation in the other Nordic countries. Net imports of electricity covered 16 per cent of total electricity consumption.
Total electricity consumption went down by four per cent in 2011. The volume of electricity bought for heating use was decreased by the milder autumn compared to previous years. Consumption of electricity totalled 84.2 terawatt hours. The consumption of district heat also decreased due to warmer weather than in previous years. The amount of district heating consumed totalled 32.0 TWh.
Energy consumption in transport was at the same level as in 2010. According to Statistics Finland's statistics on energy prices, the prices of transport fuels, especially diesel and petrol, went up in 2011.
Carbon dioxide emissions from the production and use of energy decreased by some 12 per cent from 2010, to 51.7 million tonnes of carbon dioxide.
CO2-emissions from fuel combustion 2010–2011, million tonnes
| 2011 1) | 2010 | Change % | |
| CO2-emissions 2) | 51,7 | 59,0 | -12,3 |
2) includes emissions from fuel combustion of fossil fuels and peat (CRF 1.A)
According to Statistics Finland's statistics on production of electricity and heat, the use of fuels in electricity and heat production went down by ten per cent in 2011. The fall in the emissions was especially due to decreased use of oil, natural gas, peat and coal in heat and power production. Carbon dioxide emissions in the energy sector accounted for 77 per cent of all greenhouse gas emissions in Finland in 2011.
Link to Statistical release on greenhouse gas emissions (13 Dec. 2012)
Source: Energy supply and consumption, Statistics Finland
Inquiries: Bate Ismail 09 1734 2471, energia@stat.fi
Director in charge: Leena Storgårds
Publication in pdf-format (333.3 kB)
- Tables
-
Tables in databases
Pick the data you need into tables, view the data as graphs, or download the data for your use.
- Figures
-
- Appendix figure 1. Total energy consumption 2011 (13.12.2012)
- Appendix figure 2. Total energy consumption 1970 - 2011 (13.12.2012)
- Appendix figure 3. Energy and electricity intensity 1970 - 2011 (13.12.2012)
- Appendix figure 4. Renewable energy sources 1970 - 2011 (13.12.2012)
- Appendix figure 5. Electricity supply 1970 - 2011 (13.12.2012)
- Appendix figure 6. Electricity consumption by sector 1970 - 2011 (13.12.2012)
Updated 13.12.2012
Official Statistics of Finland (OSF):
Energy supply and consumption [e-publication].
ISSN=1799-7976. 2011. Helsinki: Statistics Finland [referred: 12.2.2026].
Access method: http://stat.fi/til/ehk/2011/ehk_2011_2012-12-13_tie_001_en.html

