

Published: 21 September 2015
Total energy consumption fell by 5 per cent in January to June
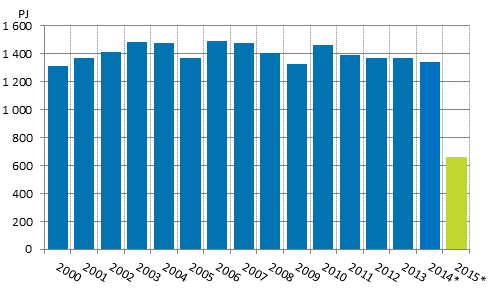
According to Statistics Finland's preliminary data, total energy consumption in January to June amounted to 660 PJ (petajoule), which was almost five per cent less than in the corresponding period in 2014. Electricity consumption amounted to 42 terawatt hours (TWh), which is one per cent lower than one year earlier. Carbon dioxide emissions from the production of energy decreased by nine per cent year-on-year.
Total energy consumption
*preliminary
Among individual energy sources, the largest reduction of 17 per cent was seen in the consumption of peat in the January to June period. The consumption of coal (including hard coal, coke, and blast furnace and coke oven gas) decreased by 15 per cent and that of natural gas by 13 per cent. In turn, the consumption of oil grew by one per cent and that of wood fuels fell by four per cent.
The low price of electricity in the Nordic electricity market weakened the profitability of electricity production by reducing the generation of electricity based on burning. In the first half of the year, 18 per cent less electricity was produced with condensate power than in the corresponding period of last year. Electricity generated in combined heat and power production went down by four per cent. Electricity generated with nuclear power decreased by five per cent, which is mainly explained by a nearly three-week extra maintenance shutdown of one nuclear power plant unit.
More energy than one year earlier was produced with renewable energy sources, hydro and wind power. The production of hydro power increased by nine per cent due to heavy rains. During the year, a large number of new wind farms have been set up in Finland and the production of wind power grew by as much as 117 per cent.
Net imports of electricity contracted by four per cent in January to June compared with the corresponding period of the previous year. Imports from the Nordic countries went down by 12 per cent. The volume of energy imported from Russia in turn grew by 95 per cent on account of the low level in last year's corresponding period. In June, a low volume of electricity was exported for the first time to Russia for commercial reasons.
In January to June, diverse energy products were imported into Finland to the value of EUR four billion, which was 37 per cent less than one year earlier. Most energy products were imported from Russia, whose share of the value of imports was 59 per cent. Energy products were exported to the value of EUR 1.7 billion, which was 49 per cent less than one year previously. The contraction of exports was most significant for oil products due to maintenance shutdowns in production. Most energy products were exported from Finland to EU countries, which accounted for 86 per cent of the value of exports.
In June, stocks of coal amounted to 24 TWh, which was five per cent more than one year earlier. At the end of June, it was estimated that the peat stocks contained 13 TWh of energy peat, which was 11 per cent more than one year earlier.
Total energy consumption by source (TJ) and CO2 emissions (Mt)
| Energy source 4) | I-II/2015* | Annual change-%* | Percentage share of total energy consumption* |
| Oil | 149,775 | 1 | 23 |
| Coal 1) | 57,765 | -15 | 9 |
| Natural gas | 44,240 | -13 | 7 |
| Nuclear Energy 2) | 118,479 | -5 | 18 |
| Net Imports of Electricity 3) | 29,590 | -4 | 5 |
| Hydro power 3) | 29,973 | 9 | 5 |
| Wind power 3) | 3,927 | 117 | 1 |
| Peat | 30,507 | -17 | 5 |
| Wood fuels | 170,741 | -4 | 26 |
| Others | 24,920 | 1 | 4 |
| TOTAL ENERGY CONSUMPTION | 659,917 | -5 | 100 |
| Bunkers | 18,485 | 32 | . |
| CO2 emissions from energy sector | 21 | -9 | . |
2) Conversion of electricity generation into fuel units: Nuclear power: 10.91 TJ/GWh (33% total efficiency)
3) Conversion of electricity generation into fuel units: Hydro power, wind power and net imports of electricity: 3.6 TJ/GWh (100%)
4) *Preliminary
Source: Statistics Finland, Energy supply and consumption
Inquiries: Ville Maljanen 029 551 2691, energia@stat.fi
Director in charge: Ville Vertanen
Publication in pdf-format (282.8 kB)
- Tables
-
Tables in databases
Pick the data you need into tables, view the data as graphs, or download the data for your use.
- Figures
-
- Appendix figure 1. Changes in GDP, Final energy consumption and electricity consumption (21.9.2015)
- Appendix figure 2. Carbon dioxide emissions from fossil fuels and peat use (21.9.2015)
- Appendix figure 3. Hard coal consumption (21.9.2015)
- Appendix figure 4. Consumption of natural gas (21.9.2015)
- Appendix figure 5. Peat consumption (21.9.2015)
- Appendix figure 6. Domestic oil deliveries (21.9.2015)
- Revisions in these statistics
-
- Revisions in these statistics (21.9.2015)
Updated 21.9.2015
Official Statistics of Finland (OSF):
Energy supply and consumption [e-publication].
ISSN=1799-7976. 2nd quarter 2015. Helsinki: Statistics Finland [referred: 26.7.2026].
Access method: http://stat.fi/til/ehk/2015/02/ehk_2015_02_2015-09-21_tie_001_en.html