Published: 7 December 2016
Total energy consumption fell in 2015
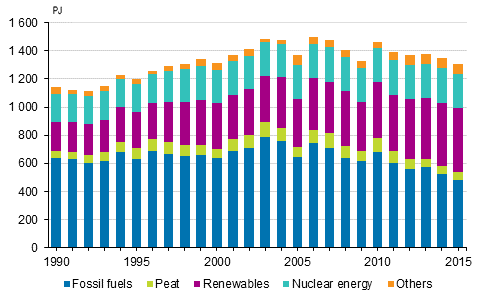
According to Statistics Finland, total consumption of energy in Finland amounted to 1.30 million terajoules (TJ) in 2015, which was three per cent less than in the year before. The consumption of electricity totalled 82.5 terawatt hours (TWh), which was one per cent less than in the previous year. The use of renewable energy sources increased by two per cent and that of fossil fuels fell by eight per cent. Wood fuels remained the biggest energy source although their use went down by two per cent.
Total energy consumption 1990–2015

The share of renewable energy in total energy consumption grew to 35 per cent in 2015. The share of wood fuels in Finland's total energy consumption continued to grow and was 25 per cent. EU targets for renewable energy are calculated relative to total final energy consumption. Early estimated in this manner, the share of renewable energy was over 39 per cent in Finland in 2015 based on preliminary data. Final data will be released on Eurostat's website in February/March 2017. Finland's target for the share of renewable energy is 38 per cent of final energy consumption in 2020, which was reached for the first time in 2014.
The use of fossil fuels went down by eight per cent from the year before. Of fossil fuels, the use of natural gas fell by 14 per cent and the use of peat by five per cent from the year before. The consumption of coal (including hard coal, coke, and blast furnace and coke oven gas) decreased by 20 per cent. According to Statistics Finland’s preliminary data, the consumption of hard coal grows in 2016.
Total energy consumption 2014–2015, terajoule
| 2014 | 2015 | Change % | |
| Wood fuels | 339 350 | 330 939 | -2 |
| Oil | 310 058 | 309 445 | 0 |
| Nuclear energy | 247 047 | 243 556 | -1 |
| Coal | 126 170 | 100 979 | -20 |
| Natural gas | 95 603 | 82 363 | -14 |
| Peat | 60 869 | 57 526 | -5 |
| Net imports of electricity | 64 678 | 58 813 | -9 |
| Hydro power | 47 665 | 59 703 | 25 |
| Wind power | 3 986 | 8 378 | 110 |
| Others | 53 736 | 52 885 | -2 |
| Total | 1 349 163 | 1 304 589 | -3 |
In 2015, the amount of electricity produced with renewable energy sources increased by 17 per cent from 2014 because the amount of electricity produced with hydro power grew by 25 per cent and that produced with wind power more than doubled. The share of wind power was 3.5 per cent of the electricity produced. The production of nuclear power remained on level with the previous year. In all, 33.7 per cent of Finland's electricity production was covered by nuclear energy.
The amount of biofuels used in road transport doubled and the share rose to top level in Europe in 2014 and remained at the same level in 2015. The electricity use of electric cars tripled from 2014, but their number is still very small. The use of biogas in road transport has continued to grow steadily.
Imports of electricity decreased by one per cent. Most electricity was imported from Sweden, 17.4 TWh. Finland was a net buyer on the Nordic electricity market. Imports from Russia increased by 16 per cent from the year before. Net imports of electricity covered 20 per cent of total electricity consumption..
Electricity consumption went down by one per cent in 2015. The consumption of electricity totalled 82.5 TWh. The consumption of district heating also decreased from the year before. The amount of district heating consumed totalled 31.5 TWh.
Final energy consumption decreased by two per cent from the year before. Final energy consumption in transport remained at the same level and energy consumption in space heating decreased by five per cent from the year before. Final consumption in manufacturing contracted by two per cent. In 2015, the volume of industrial output fell further from the year before, which was also reflected in energy use in manufacturing. Energy consumption now fell for the fifth successive year, coming close to the figures of 2009, to the level of the drop following the financial crisis.
Source: Energy supply and consumption, Statistics Finland
Inquiries: Bate Ismail 029 551 2471, energia@stat.fi
Director in charge: Ville Vertanen
Publication in pdf-format (301.0 kB)
- Tables
-
Tables in databases
Pick the data you need into tables, view the data as graphs, or download the data for your use.
- Figures
-
- Appendix figure 1. Total energy consumption 2015 (7.12.2016)
- Appendix figure 2. Total energy consumption 1970 - 2015 (7.12.2016)
- Appendix figure 3. Energy and electricity intensity 1970 - 2015 (7.12.2016)
- Appendix figure 4. Renewable energy sources 1970 - 2015 (7.12.2016)
- Appendix figure 5. Electricity supply 1970 - 2015 (7.12.2016)
- Appendix figure 6. Electricity consumption by sector 1970 - 2015 (7.12.2016)
Updated 07.12.2016
Official Statistics of Finland (OSF):
Energy supply and consumption [e-publication].
ISSN=1799-7976. 2015. Helsinki: Statistics Finland [referred: 20.2.2026].
Access method: http://stat.fi/til/ehk/2015/ehk_2015_2016-12-07_tie_001_en.html

