Published: 20 December 2021
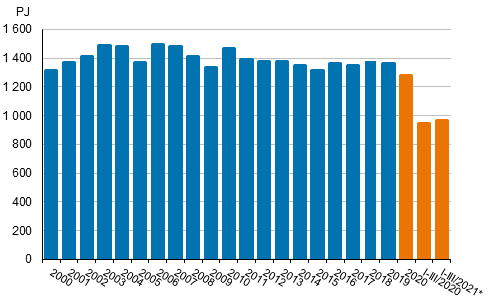
Total energy consumption grew by 3 per cent in January to September
According to Statistics Finland's preliminary data, total energy consumption in January to September amounted to 966 petajoule, which was three per cent more than in the corresponding period in the year before. Electricity consumption amounted to 62.1 terawatt hours (TWh), which was four per cent more than one year earlier. Carbon dioxide emissions from the use of fuels increased by two per cent year-on-year.
Total energy consumption

*preliminary
Among energy sources, the growth was biggest for coal, the consumption of which rose by 17 per cent in January to September from the corresponding period of the year before. The consumption of peat declined most, by 24 per cent. The consumption of natural gas declined but was still eight per cent higher in January to September than one year earlier. In the third quarter, the consumption of natural gas diminished by 17 per cent. Changes in the price ratios of the fuel market were also visible in the demand for coal and natural gas in the third quarter.
In January to September, production of nuclear power decreased by one per cent year-on-year. The volumes of combined production and condensate production grew by 5 and 21 per cent. Among renewable electricity production, production of hydro power grew by one per cent and production of wind power decreased by six per cent. Net imports of electricity grew by 17 per cent from the year before and accounted for 21 per cent of total electricity consumption.
In January to September, diverse energy products were imported to Finland to the value of EUR 6.5 billion, which was 33 per cent more than one year earlier. Most energy products were imported from Russia, whose share of the value of imports was 50 per cent. Energy products were exported from Finland to the value of EUR 2.8 billion. The value of exports increased by 2 per cent compared to January to September of the previous year. Energy products were exported most to OECD countries, which accounted for 65 per cent of the value of exports.
Total energy consumption by source (TJ) and CO2 emissions (Mt)
| Energy source | I-III/2021* | Annual change-% | Percentage share of total energy consumption |
| Oil (fossil) 1) | 201,710 | 1 | 21 |
| Coal 2) | 58,444 | 17 | 6 |
| Natural gas 3) | 57,058 | 8 | 6 |
| Nuclear energy 4) | 179,850 | -1 | 19 |
| Net imports of electricity 5) | 46,829 | 17 | 5 |
| Hydro power 5) | 41,444 | 1 | 1 |
| Wind power 5) | 18,859 | -6 | 2 |
| Peat | 23,770 | -24 | 2 |
| Wood fuels | 272,996 | 4 | 28 |
| Others (fossil) | 8,281 | -3 | 1 |
| Others (bio) | 50,882 | 11 | 5 |
| Others | 6,168 | -12 | 1 |
| TOTAL ENERGY CONSUMPTION | 966,291 | 3 | 100 |
| CO2 emissions from energy sector | 25 | 2 | . |
. = Category not applicable
1) Oil: includes the bio part of transport fuels.
2) Coal: includes hard coal, coke, blast furnace gas and coke oven gas.
3) The consumption of natural gas does not include raw material use.
4) Conversion of electricity generation into fuel units: Nuclear power: 10.91 TJ/GWh (33% total efficiency)
5) Conversion of electricity generation into fuel units: Hydro power, wind power and net imports of electricity: 3.6 TJ/GWh (100%)
Source: Statistics Finland, Energy supply and consumption
Inquiries: Aleksi Sandberg 029 551 3326, energia@stat.fi
Head of Department in charge: Katri Kaaja
Publication in pdf-format (260.6 kB)
- Tables
-
Tables in databases
Pick the data you need into tables, view the data as graphs, or download the data for your use.
- Figures
-
- Appendix figure 1. Changes in GDP, Final energy consumption and electricity consumption (20.12.2021)
- Appendix figure 2. Carbon dioxide emissions from fossil fuels and peat use (20.12.2021)
- Appendix figure 3. Coal consumption (20.12.2021)
- Appendix figure 4. Natural gas consumption (20.12.2021)
- Appendix figure 5. Energy peat consumption (20.12.2021)
- Appendix figure 6. Domestic oil deliveries (20.12.2021)
- Revisions in these statistics
-
- Revisions in these statistics (20.12.2021)
Updated 20.12.2021
Official Statistics of Finland (OSF):
Energy supply and consumption [e-publication].
ISSN=1799-7976. 3rd quarter 2021. Helsinki: Statistics Finland [referred: 17.2.2026].
Access method: http://stat.fi/til/ehk/2021/03/ehk_2021_03_2021-12-20_tie_001_en.html

