Published: 8 October 2019
Households’ energy consumption remained unchanged in 2017
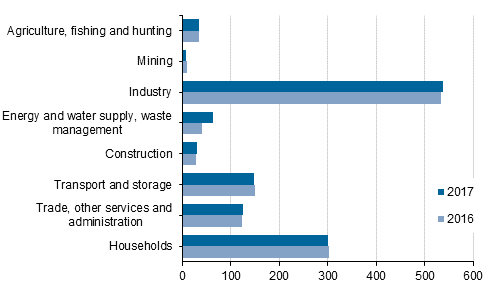
The final consumption of energy products by Finns in Finland and abroad grew by two per cent from the previous year to 1,200 petajoule in 2017. The biggest share of energy was consumed by manufacturing, as the 537 petajoule it consumed corresponded with 43 per cent of the final consumption of energy products. Energy use in manufacturing grew by one per cent year-on-year. Households consumed 300 petajoule of the energy, which was in line with the year before. The share of households in total final consumption of energy products stood at 24 per cent.
Final consumption of energy by industry in 2016 and 2017, petajoules

The use of biofuels increased by eight per cent from the year before to 403 petajoule. The growth was particularly visible in land transport, where the use of biofuels more than doubled as the consumption of biodiesel increased. In energy supply, the consumption of biofuels increased by three per cent from the year before as the use of biomass and wood fuels increased. The consumption of biofuels also increased by two per cent among households from the previous year as the use of bio transport fuels grew.
In land transport, the consumption of oil products decreased by 11 per cent as a result of increased use of biofuels. The consumption of oil products also decreased by two per cent among households. However, the use of oil products remained at the 2016 level as consumption by manufacturing increased by six per cent.
Electricity consumption increased by 0.2 per cent from 2016 to 315 petajoule. Electricity consumption grew by 1.1 per cent in manufacturing. The majority of the growth came from the forest industry. Households’ electricity consumption remained at the previous year's level at 81 petajoule.
Total supply and consumption of energy products by industry in 2017, TJ
| Industry (TOL2008) | Supply | Use |
| Agriculture, fishing and aquaculture, hunting | 1 698 | 23 442 |
| Forestry | 203 865 | 5 002 |
| Mining and quarrying | 273 354 | 1 873 |
| Food industry | 212 | 3 457 |
| Forest industry | 154 761 | 191 538 |
| Oil refining and manufacture of chemicals | 758 523 | 855 421 |
| Manufacture of basic metals and fabricated metal products | 14 140 | 56 194 |
| Other industries | . | 11 964 |
| Energy management | 5 574 | 553 506 |
| Water supply and waste management | . | 1 847 |
| Construction | . | 29 192 |
| Trade | . | 1 963 |
| Land transport | . | 57 063 |
| Water transport | . | 35 101 |
| Air transport | . | 44 034 |
| Support activities for transportation, postal activities | . | 857 |
| Real estate activities | . | 2 766 |
| Other service activities and administration | . | 21 847 |
| Households | . | 149 326 |
| Change in Inventories | . | 46 865 |
| Rest of the World | 997 280 | 414 272 |
| Statistical Differences | . | 4 400 |
| TOTAL | 2 409 408 | 2 409 408 |
Energy accounts are part of the second stage of the European Union’s Regulation concerning environmental accounts that became legally valid in June 2014 ((EC) No 538/2014). The Regulation obliges the Member States to compile statistics and report annually on energy accounts.
The goal of environmental accounts is to describe the interaction between the environment and the economy by mainly using the same basic concepts and classifications as national accounts (ESA 2010). In the energy accounts, the supply and use of energy are presented in accordance with the industrial classification and domicile principle used in national accounts. Thus, the data of the statistics can be connected to various monetary variables of national accounts, such as total output and value added. The energy accounts’ data on the supply and use of energy can also be combined with the data of the statistics on environmental taxes and emissions into air by industry.
Unlike other statistics on energy, energy accounts also contain the supply and consumption of energy by Finns abroad, in accordance with the framework of national accounts. Correspondingly, the supply and consumption of energy by foreigners within Finland are subtracted from energy accounts. Unlike in national accounts, statistics describing the physical flows of environmental accounts, including Energy accounts, do not take into account global factoryless production and merchanting.
Source: Energy Accounts 2017, Statistics Finland
Inquiries: Juuso Peltola 029 551 2330, ymparistotilinpito@stat.fi
Director in charge: Ville Vertanen
Publication in pdf-format (260.6 kB)
- Tables
-
Tables in databases
Pick the data you need into tables, view the data as graphs, or download the data for your use.
Appendix tables
- Appendix table 1. Households' consumption of energy products in 2011 to 2017, TJ (8.10.2019)
- Appendix table 2. Consumption of energy products by industry in 2017, TJ (8.10.2019)
- Appendix table 3. Consumption of oil products and crude oil in 2011 to 2017, TJ (8.10.2019)
- Appendix table 4. Consumption of biofuels (excl. peat) by industry in 2011 to 2017, TJ (8.10.2019)
- Appendix table 5. Final consumption of electricity and heat by industry in 2011 to 2017, TJ (8.10.2019)
- Appendix table 6. Consumption of other energy products by industry in 2011 to 2017, TJ (8.10.2019)
Updated 8.10.2019
Official Statistics of Finland (OSF):
Energy Accounts [e-publication].
ISSN=2489-5741. 2017. Helsinki: Statistics Finland [referred: 15.2.2026].
Access method: http://stat.fi/til/entp/2017/entp_2017_2019-10-08_tie_001_en.html

