Published: 15 June 2017
Amounts of waste from production both increased and decreased; the economic cycles of mining and quarrying pulled the total amount of waste in their direction in 2015
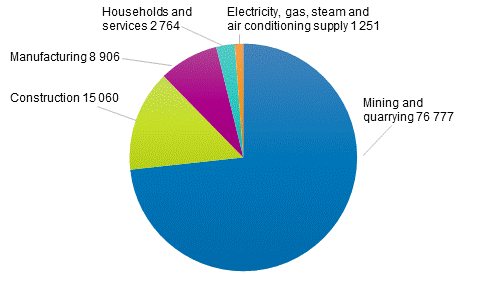
Compared to the previous year, the total amount of waste generated in 2015 grew by over ten per cent. This was despite the fact that our manufacturing’s total amount of waste fell considerably in 2015 from the previous reference year, 2014; from around 10.3 to 8.9 million tonnes. However, the amounts of surface soil, waste stone and ore dressing sand generated by mining and quarrying had a rising effect on the total amount of waste due to their large quantities. Over 76 million tonnes of surface soil dug to uncover ore, waste stone from mines and ore dressing sand from separation of valuable ore minerals were generated from mining and quarrying. The amount of waste from energy production largely followed the trend of manufacturing, the decrease in the amounts of waste accumulated was similar to manufacturing, being only around 85 per cent from the previous year.
Waste generated by sector and type in 2015, 1,000 tonnes per year

The statistics on waste from construction are based on the amount of construction waste received in pre-processing plants, utilisation sites like civil engineering sites and stockpiling areas. The drop in the amount of waste from construction was lower than for manufacturing, nearly eight per cent from the previous year, but the figures in the statistics include larger amounts of concrete waste than before, which has in part curbed the drop in the total amount.
There has not been much change in the total amount of hazardous waste, the drop of a few per cent can be explained by cyclical variations in manufacturing.
In the statistics, waste management has earlier included waste deposited at landfills in the separate category other final management, which comprises many types of waste from manufacturing that are disposed in reservoirs. For mineral waste like soil mass and waste from mining and quarrying, the recovery rates have fallen and landfill disposal and other final treatment such as reservoirs have correspondingly grown. For incineration of waste, the total amount of energy recovered waste and waste reported as incinerated without energy recovery has remained unchanged, at nearly five million tonnes, but more waste than before was recorded in 2015 as energy recovered instead of disposal by incineration.
Source: Waste statistics 2015, Statistics Finland
Inquiries: Juha Espo 029 551 3463, Simo Vahvelainen 029 551 3457, ymparisto.energia@stat.fi
Director in charge: Ville Vertanen
Publication in pdf-format (304.0 kB)
- Tables
-
Tables in databases
Pick the data you need into tables, view the data as graphs, or download the data for your use.
Appendix tables
- Appendix table 1. Waste generation in 2015, tonnes (15.6.2017)
- Appendix table 2. Waste treatment in 2015, tonnes (15.6.2017)
Updated 15.6.2017
Official Statistics of Finland (OSF):
Waste statistics [e-publication].
ISSN=2323-5314. 2015. Helsinki: Statistics Finland [referred: 18.2.2026].
Access method: http://stat.fi/til/jate/2015/jate_2015_2017-06-15_tie_001_en.html

