1. Review of general government expenditure by function in 2012
Total general government expenditure amounted to EUR 109.1 billion in 2012. It grew by EUR five billion from 2011, or by 4.8 per cent. The ratio of expenditure to GDP was 56.7 per cent and it grew by 1.6 percentage points. The ratio grew because current price growth of general government expenditure (4.8%) was faster than current price growth of gross domestic product (1.9%).
The biggest function group in total expenditure was social protection, whose expenditure totalled EUR 47.7 billion. As in the previous year, the next biggest expenditure items were health, general public services and education. The growth from the year before was biggest in the function group of social protection.
Social protection is divided into nine sub-groups, the biggest of which are old age (expenditure EUR 22.6 billion), sickness and disability (EUR 9.2 billion), and family and children (EUR 6.6 billion). Expenditure related to old age grew by 8.5 per cent, i.e. EUR 1.8 billion from the year before. As in the previous year, expenditure in the function group of old age increased most.
1.1 General government expenditure by sector
General government divides into three sectors: central government, local government and social security funds, which include employment pension schemes and other social security funds. Local government mainly refers to municipalities and joint municipal authorities. Universities are classified under central government. Expenditure in the sub-sectors of general government can be examined as unconsolidated or consolidated. When expenditure is consolidated, current transfers, capital transfers and property expenditure between sub-sectors are removed. Generally, total general government expenditure is examined consolidated and that of sub-sectors unconsolidated.
In 2012, unconsolidated total expenditure of social security funds grew by 6.1 per cent from the year before, the growth mainly coming from increased pension expenditure of employment pension schemes. Local government's expenditure went up by 4.9 per cent and central government's by 3.8 per cent. Total local government expenditure increased most in health and social protection functions. In the sub-groups of social protection, expenditure of services related to sickness and disability, and family and children grew most. In central government, the growth was fast in defence and social protection expenditure. Most of social protection expenditure consisted of transfers to the rest of general government. Acquisitions made in 2012 increased defence expenditure.
1.2 Consumption expenditure describes current expenses of service production
Consumption expenditure depicts current expenses incurred by general government from the production of services. Consumption expenditure includes compensation of employees, intermediate consumption, consumption of fixed capital and services bought direct to customers from private operators, that is, social benefits in kind. Received sales proceeds and paid income are deducted from consumption expenditure. Consumption expenditure excludes such as income transfers and interest expenses.
Examination of consumption expenditure may give a better view of the development of expenses than only that of total expenditure, where income received from activity is not taken into consideration. In some cases, the production structure may have an effect on the amount of total expenditure. For example, when general government buys services from another general government unit, total expenditure rises, but at the same time, income also grows by the same amount. Purchases of intermediate products by general government units from each other are not consolidated from total expenditure, unlike income transfers, property expenditure and capital transfers between general government units.
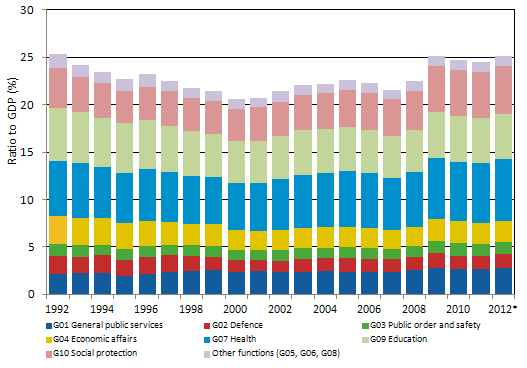
In 2012, general government consumption expenditure totalled EUR 48.3 billion and its ratio to GDP was 25.1 per cent. The majority of consumption expenditure concerned welfare services, that is, the function groups of health, education and social protection. The largest function group was health and the second largest social protection.
Figure 1. Consumption expenditure of general government by function in 1992 to 2012* (Ratio to GDP)

Consumption expenditure was highest in the local government sector. Over 80 per cent of local government consumption expenditure consists of health, education and social work expenditure. Central government has the second highest consumption expenditure. In central government, the biggest function group is promotion of economic affairs, where the largest part of consumption expenditure relates to the maintenance of the transport network. The next largest function groups are defence, general public services, and public order and safety. In addition to central administration, general public services include universities' research expenditure, for example. Social security funds' consumption expenditure relates to health care and social work and mainly comprises social benefits in kind.
1.3 The largest part of wages and salaries paid by general government directed to health
Compensation of employees paid by general government is part of consumption expenditure. Compensation of employees comprises employers' compulsory social contributions and wages and salaries paid to wage and salary earners including employees' social security contributions. In 2012, paid compensation of employees amounted to EUR 27.9 billion, of which paid wages and salaries made up EUR 21.9 billion and employers' social contributions EUR 6.0 billion. Of wages and salaries, local government paid EUR 16.0 billion and central government EUR 5.4 billion. Social security funds paid EUR 0.4 billion in wages and salaries. The share of wages and salaries in total general government expenditure was 20 per cent.
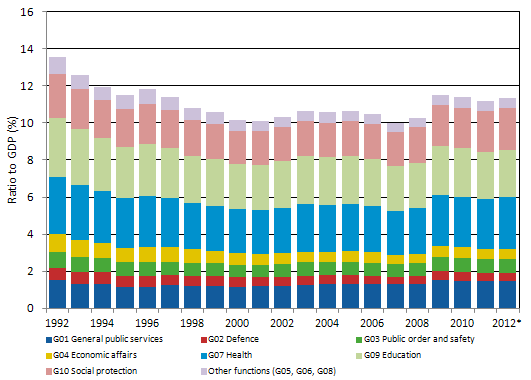
By comparing wages and salaries paid, it can be assessed in which functions general government has employees. In 2012, wages and salaries were highest in the function groups of health (EUR 5.3 billion) and education (EUR 4.9 billion). Until 2007, the amount of wages and salaries was highest in the functions of education, after that, health has become the biggest function group. Of individual function sub-groups, most wages and salaries were paid in the health sub-group of hospital services in 2012. The amount of wages and salaries in the function groups of health, education and social protection has grown most over the 2000s.
Figure 2. Wages and salaries paid by general government by function relative to GDP in 1992 to 2012*

The ratio of wages and salaries paid to GDP has remained even throughout the period. The ratio has been at its highest in 1992, when it was 13.5 per cent. The GDP ratio contracted after the recession in the 1990s, when gross domestic product grew faster than the sum of wages and salaries. The ratio settled to slightly over ten per cent for the beginning of the 2000s, and it was at its lowest in over 30 years in 2007, until the economic crisis started in 2009. The GDP ratio of central government wages and salaries was, however, lower than before the 1990s. In 2012, the ratio of wages and salaries paid by general government to GDP was 11.4 per cent and that of employers' social contributions 3.1 per cent.
2. Comparison of total expenditure is difficult
Public expenditure is usually examined by the ratio of expenditure to gross domestic product. A common misinterpretation of the figure is that general government is understood to produce the share concerned of gross domestic product. This is, however, a different matter. The GDP ratio of total general government expenditure is a ratio that compares two different key figures to each other. Most of general government expenditure is expenses that are not included in gross domestic product, but are income transfers and property expenditure, for example. Gross domestic product consists of public and private value added, which means the value of the goods and services produced in the national economy.
When comparing total general government expenditure internationally or between different periods, conclusions cannot be made by viewing only the GDP ratio of total expenditure. Background factors may have a significant effect on the ratio, even if the same services and income transfers were produced equally efficiently. Plenty of information is required for precise comparison. Comparability is affected by such as the structure of general government, the units classified there, the functions held by general government, various service production modes, taxability of income transfers, implementing income transfers as tax deductions, and the economic situation. In addition to expenditure, the ratio is considerably influenced by changes in GDP, and this makes its interpretation more difficult in the shorter term.
Inclusion of pension systems in public expenditure varies by country and hinders the comparison. In Finland, the pension systems are quite exhaustively included in general government and general government expenditure. The production structure of general government may also have an effect on the comparison. For example, when a municipality buys intermediate services from another municipality, expenditure grows, but paid income also increases by the same amount. However, income and capital transfers and property expenditure between general government units are consolidated, i.e. netted from expenditure. In Finland, many social benefits are taxable, for which reason their level is higher than in countries where they are treated differently. A weak economic situation has a twofold effect on the comparison, the divisor of the ratio, i.e. GDP, lowers and income transfers, such as unemployment benefits grow.
Alternative key figures to be examined besides total expenditure are the ratio of consumption expenditure to gross domestic product, the share of value added of general government in gross domestic product or the share of general government in total demand. The weakness for these is that income transfers are not included in the key figure.
Table 1. General government key figures in European countries in 2012 1)
| Share of value added | Consumption expenditure, ratio to GDP | Total expenditure, ratio to GDP | |
| Finland | 19,7 | 25,1 | 56,7 |
| EU27 | 14,5 | 21,7 | 49,4 |
| Denmark | 23,2 | 28,5 | 59,5 |
| Germany | 10,3 | 19,3 | 44,7 |
| Estonia | 14,5 | 19,2 | 39,5 |
| Spain | 14,4 | 20,2 | 47,8 |
| France | 18,3 | 24,7 | 56,6 |
| Italy | 14,6 | 20,1 | 50,6 |
| Netherlands | 14,0 | 28,5 | 50,4 |
| Sweden | 20,2 | 26,9 | 52,0 |
| UK | 13,4 | 21,7 | 48,0 |
| Norway | 17,4 | 20,9 | 42,5 |
The GDP ratio of consumption expenditure is an established indicator by means of which the expenditure of public service production can be viewed more comparably. The concept of consumption expenditure is described in more detail in the section above. Consumption expenditure depicts the value of services produced without compensation and the production modes are more comparable. In Finland, the GDP ratio of public consumption expenditure was 25.1 per cent in 2012. It is lower than the EU's weighted average, but slightly smaller than in the Netherlands, Iceland, Denmark and Sweden, for example.
The share of general government in value added indicates how much of gross domestic product is produced by general government. In Finland, this share was 19,7 per cent in 2012. In Sweden, the corresponding share is at the same level and in Denmark slightly higher. The weighted average for EU countries is 14.5 per cent.
In national accounts data, general government expenditure is divided by type of expenditure and function, and other analyses can be made with the help of these classifications. Corresponding information is available from Eurostat's databases on other European countries.
3. Changes in the time series
Corrections and revisions have been made to the function distribution of expenditure in connection with the publication. The function distribution of social benefits paid by other social security funds was revised between social protection functions. In addition, the function distribution of state subsidies paid by the state to municipalities, i.e. income transfers, was revised starting from 2010. Several smaller corrections have also been made to the time series.
Source: National Accounts, Statistics Finland
Inquiries: Jukka Hytönen 09 1734 3484, skt.95@stat.fi
Director in charge: Leena Storgårds
Updated 31.1.2014
Official Statistics of Finland (OSF):
General government expenditure by function [e-publication].
ISSN=1798-0828. 2012,
1. Review of general government expenditure by function in 2012
. Helsinki: Statistics Finland [referred: 19.2.2026].
Access method: http://stat.fi/til/jmete/2012/jmete_2012_2014-01-31_kat_001_en.html

