Published: 15 June 2021
Number of persons working in cultural occupations and industries decreased in 2020 from the year before
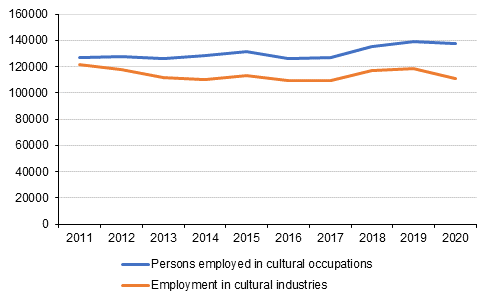
Due to the corona pandemic, the development of employment in the fields of culture was poor in 2020. After the positive development that has continued since 2017, employment weakened especially in cultural industries. According to the Labour Force Survey, employment in cultural industries was around 111,000 in 2020 (95% confidence interval ±3,300). The drop from the previous year amounted to around 5.6 per cent (Figure 1). The employment of those working in cultural occupations as their main job weakened less, by around 2.6 per cent, than that of those working in other cultural occupations, whose employment decreased by some 13 per cent.
The development of the number of persons employed in cultural occupations is more even than in cultural industries. Cultural occupations also include self-employed persons, freelancers and persons working on a grant.
According to the results of a survey on art and culture published by the Finnish Centre for Cultural Policy Research, Cupore (Ruusuvirta et al. 2021), three out of four artists responding to the survey said that the coronavirus situation had affected their artistic work. According to one fifth, the pandemic has had no effect on work and four per cent could not say whether the pandemic had had any effect.
Examined by art form, the coronavirus situation has had more effect on performing arts and music than average, most artists in these fields (91% and 90%) reported that the coronavirus situation had an effect on artistic work. Representatives of multidisciplinary art (85%) and audiovisual arts (82%) had also felt more often than average that the corona situation had affected their artistic work. According to the survey, the least affected were representatives of literature (63%), visual arts (71%) and architecture and design (71%).
Figure 1. Employment in cultural industries and occupations as main job in 2011 to 2020
Source: Statistics Finland: Labour Force Survey
According to the definition of the Labour Force Survey, a person is employed if he/she has during the survey week been in gainful employment for at least one hour against pay in money or fringe benefits, or to make a profit. Employees temporarily absent from work during the survey week are also classified as employed if the reason for absence is maternity or paternity leave or own illness or the absence has lasted for under three months. A self-employed person or an unpaid worker in an enterprise of a family member is calculated in employed regardless of the length or reason for absence.
The main job is the only or main paid job of an employed person. If there are several jobs, the main job is usually the one on which most time is spent or from which earned income is highest. The definition of the main and secondary job is based on the respondent's own reporting.
Self-employment and part-time work are common for cultural professionals
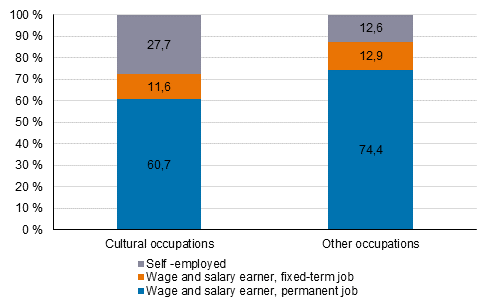
A considerably large share of those working in cultural occupations were self-employed in 2020. Seventy-two per cent were working as wage and salary earners and 28 per cent were self-employed, while the shares in other occupations were around 87 and 13 per cent (Figure 2).
Only 61 per cent of those employed in cultural occupations have a permanent employment relationship, while the corresponding share for those working in other occupations is 74 per cent. The difference is mainly explained by the large share of self-employed persons. Nearly 12 per cent of those employed in cultural occupations worked in fixed-term positions and the remaining nearly 28 per cent were self-employed. In other occupations, nearly 13 per cent were fixed-term employees but only close on 13 per cent were self-employed.
Figure 2. Permanency of employment relationship in cultural and other occupations as main job in 2020 %
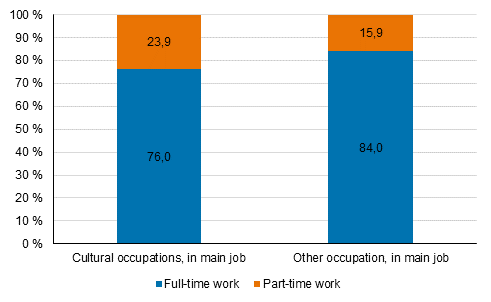
Part-time work was considerably more common in cultural occupations than in other occupations. In 2020 nearly 24 per cent of those in cultural occupations had a part-time job, while in other occupations only about 16 per cent worked part time.
Figure 3. Share of full-time and part-time employees in cultural and other occupations in 2020, %
Persons working in cultural occupations often perform project-type short-term jobs, and several simultaneous jobs are also common. Around 10 per cent of those in cultural occupations had more than one job and about six per cent of those working in other occupations in 2020.
The average weekly working time of those working in cultural occupations as their main job is shorter than among those in other occupations. It was around 32 hours in cultural occupations and over 35 hours in other occupations in 2020.
In both cultural occupations and industries, the number of men and women was almost equal on the total level in 2018. In cultural occupations, nearly 54 per cent were women ( https://pxnet2.stat.fi/PXWeb/pxweb/en/StatFin/StatFin__klt__klt/statfin_klt_pxt_11yl.px/ ).
Male-dominated occupations include sales and marketing managers (73 per cent of men in 2018), broadcasting and audio-visual technicians (82 per cent) and printers (78 per cent).
Female-dominated occupations are filing clerks (70 per cent), librarians (80 per cent), library clerks (77 per cent) and curators (77 per cent), interior designers (85 per cent), and dancers and choreographers (71 per cent) ( https://pxnet2.stat.fi/PXWeb/pxweb/en/StatFin/StatFin__klt__klt/statfin_klt_pxt_11yl.px/ ).
Professionals in the field of culture are highly educated
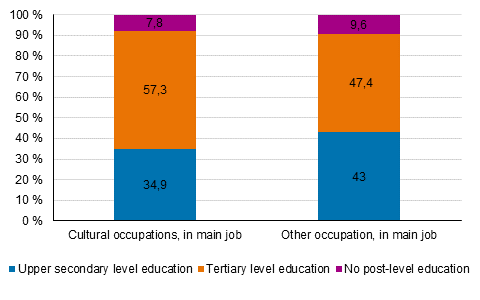
Cultural professionals are highly educated. A total of around 57 per cent of those working in cultural occupations had tertiary level education, while the share was around 47 per cent in other occupations. Around 35 per cent of employed persons in cultural occupations and nearly 47 per cent of those in other occupations had upper secondary level education. Nearly eight per cent of those employed in cultural occupations did not have post-basic level education (Figure 4).
These data derive from Statistics Finland’s Labour Force Survey and employment statistics.
Figure 4. Level of education distribution of those working in cultural and other occupations as their main job in 2020 %
Unemployment rate of those with qualifications in the field of culture one year after graduation
Statistics Finland has revised the compilation of statistics on cultural education. The classification is based on the set selected from the national classification of education 2016 (https://stat.fi/en/luokitukset/koulutus/koulutus_1_20160101/). Previously, the Finnish National Board of Education's classification of fields of education was used in the cultural statistics tables (see for more details Cultural education ).
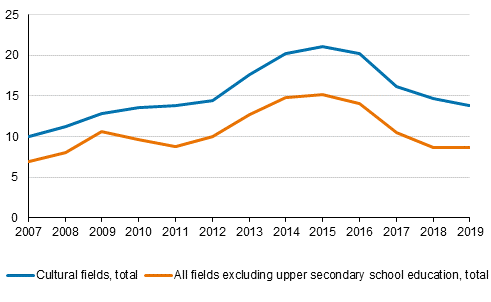
The unemployment rate of those with qualifications in the field of culture one year after graduation has long been higher than the average unemployment rate of all fields of education. In 2019, a total of 13.9 per cent of those with qualifications in the field of culture were unemployed one year after graduation, while 8.7 per cent were unemployed in all other fields excluding upper secondary general education (Database table of cultural statistics http://pxnet2.stat.fi/PXWeb/pxweb/en/StatFin/StatFin__klt__klt/statfin_klt_pxt_123w.px/ ).
Figure 5. Unemployment rate of those with qualifications from the field of culture and from all fields of education, excl. upper secondary general education, one year after graduation in 2007 to 2019 (%)
Source: Statistics Finland, Education statistics
Unemployed jobseekers in arts occupations
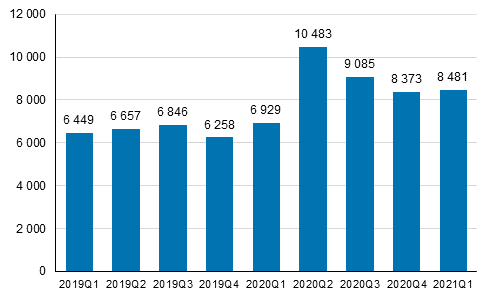
In 2020, the average number of unemployed jobseekers in arts occupations was 8,717, around 2,670 higher than in the year before. Visual artists made up over 34 per cent of all unemployed jobseekers in arts occupations. In the first quarter of 2021 the average for unemployed jobseekers in arts was 8,481, of whom 625 were laid off. The shares of graphic designers and musicians among unemployed jobseekers exceeded 16 per cent (Cultural statistics’ table service, Table 11.7 ).
These data derive from the Employment Service Statistics of the Ministry of Economic Affairs and Employment.
Figure 6. Unemployed jobseekers in arts occupations by quarter 2019Q1– 2021Q1
Source: Ministry of Economic Affairs and Employment
Earnings in cultural occupational groups
According to the structure of earnings statistics, the number of full-time monthly wage and salary earners in the private sector was 743,122 in 2019. There were nearly 28,000 private sector wage and salary earners in cultural occupations, almost four per cent.
Advertising and public relations managers attained earnings of over EUR 6,700. The average earnings of men were good EUR 7,113 and of women EUR 6,410. The lowest earnings in the private sector, around EUR 2,173, were found among textile, leather, etc. handicraft artisans ( Cultural statistics’ table service, Table 11.9 ).
In 2020, 356,811 persons worked in the local government sector, of whom nearly 5,300 were working in cultural occupations. In the local government sector, the average regular monthly earnings were about EUR 3,250. In cultural occupations they were around EUR 2,920, on average. Theatre directors earned most, around EUR 5,560, on average. City architects also attained earnings of nearly EUR 5,200. Museum assistants’ earnings remained under EUR 2,000, as they earned EUR 2,024, on average ( Cultural Statistics’ table service, Table 11.8 ).
Sources:
Statistical sources:
Statistics Finland: Labour Force Survey
Statistics Finland: Employment statistics
Statistics Finland: Education statistics
Statistics Finland: Statistics on wages and salaries
Ministry of Economic Affairs and Employment: Unemployed jobseekers
and laid off persons
Other sources:
Ruusuvirta, Lahtinen, Rensujeff, Kurlin, Niiniaho (2021). Arts and
Culture Barometer 2020, Cupore online publications 67, Centre for
Cultural Policy Research Cupore.
Source: Cultural statistics 2020, Statistics Finland
Inquiries: Kaisa Weckström 029 551 2348, kulttuuri.tilastokeskus@stat.fi
Head of Department in charge: Hannele Orjala
Publication in pdf-format (247.4 kB)
- Tables
-
Tables in databases
Pick the data you need into tables, view the data as graphs, or download the data for your use.
Updated 15.6.2021
Official Statistics of Finland (OSF):
Culture [e-publication].
ISSN=2341-7404. Cultural Employment in Finland 2020. Helsinki: Statistics Finland [referred: 23.2.2026].
Access method: http://stat.fi/til/klt/2020/01/klt_2020_01_2021-06-15_tie_001_en.html

