Published: 3 November 2016
Share of households with cars has stabilised, number of pet owners is increasing
The interviews conducted by Statistics Finland for the Household Budget Survey in the first half of 2016 have generated interesting results. The interviews will continue until the beginning of 2017.
The share of households owning a car has not increased
Seventy-four per cent of households had at least one car in 2012 and 2016. The shares of households owning more than one car have not changed since 2012. Seventeen per cent of households had two cars and around three per cent had three or more cars. The number of households that use cars has increased slightly as there are now around 70,000 more households than in 2012. The share of households owning other motor vehicles have not increased either from 2012 to 2016. Eleven per cent of households did not even own a bicycle in the first half of 2016.
The number of pets owned by households is increasing
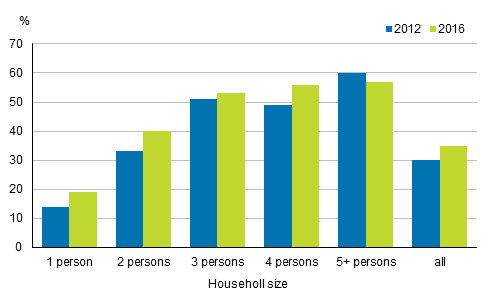
Around 35 per cent of households have a pet of some kind. In 2012, altogether 30 per cent of households had a pet. Twenty-two per cent of households have at least one dog and 15 per cent have at least one cat. Four per cent of households have both a cat and a dog. In 2012, in total 19 per cent of households had at least one dog, 14 per cent at least one cat, and three per cent both a dog and a cat. Around two per cent of households had an aquarium or terrarium. One per cent of households had a pony or a riding horse. There were very little other pets. The share and number of households owning pets have thus grown.
Percentage shares of households owning pets in 2012 and 2016

In the first half of 2016, households had a total of around 800,000 dogs, while in 2012 the number of dogs was some 630,000. It seems that an increasing number of households have two dogs to keep each other company. The number of cats in households has not increased over the past four years and the number is almost unchanged at around 600,000 cats.
Preliminary data on new services
According to preliminary data from the Household Budget Survey’s interviews nine per cent of those who had made independent leisure trips by air had paid the carbon offset. The share is surprisingly high.
Fourteen per cent of households use charged music streaming services and 41 per cent use charged television services.
One per cent of households have a panic alarm phone with a monthly fee. Eighty per cent of panic alarm phones are found among the oldest age group.
Three per cent of households have an alarm system with a monthly fee. Nearly 80 per cent of the households with an alarm system live in detached houses.
Dwelling-specific water measuring has increased clearly. In 2016, altogether 26 per cent of households living in blocks of flats used it while in 2012 the share was 17 per cent. Among households living in terraced houses, 50 per cent had dwelling-specific water measuring, as was also the case in 2012.
Households consume in a somewhat subdued atmosphere
The table depicts how respondents view the economic situation of their household compared to the previous year in the first half of 2016.
The respondent's view on the households economic situation compared to the previous year according to the age of the household’s reference person, per cent
| View of economic situation | Age group | ||||||
| Under 35 years | 35 to 44 years | 45 to 54 years | 55 to 64 years | 65 to 74 years | 75+ years | All | |
| Changed for the better | 33 | 27 | 19 | 12 | 6 | 6 | 19 |
| Remained unchanged | 45 | 46 | 52 | 63 | 74 | 72 | 57 |
| Changed for the worse | 22 | 27 | 28 | 25 | 20 | 22 | 24 |
Even though a majority of households felt that there had been no changes in the economic situation, large changes were visible in the two youngest household groups. More positive changes than negative changes only occurred in the under 35-year-old households. The older the age group the less changes but the economic situation has, however, weakened for clearly more households than improved among those aged 45 or over. Based on the table one could assume that households were not planning to increase their consumption in the first half of 2016 compared with the previous year.
Statistics on the 2016 consumption of Finns
Statistics Finland’s interviewers have collected data on all consumption expenditure and consumer durables of Finnish households throughout 2016. The data collection continues until January 2017. In addition to spending money the interviews inquire, for example, about the use of new services and products and about durable consumer goods and housing. In addition, households collect shopping receipts for purchases of daily goods for a fortnight to complement the interviews.
First data on the consumption of different population groups for 2016 will be published in December 2017.
Source: Households’ consumption 2016. Statistics Finland
Inquiries: Juha Nurmela 029 551 2548, kulutus.tilastokeskus@stat.fi
Director in charge: Jari Tarkoma
Publication in pdf-format (168.6 kB)
- Tables
-
Tables in databases
Pick the data you need into tables, view the data as graphs, or download the data for your use.
Updated 3.11.2016
Official Statistics of Finland (OSF):
Households' consumption [e-publication].
ISSN=2323-3028. 2016. Helsinki: Statistics Finland [referred: 4.2.2026].
Access method: http://stat.fi/til/ktutk/2016/ktutk_2016_2016-11-03_tie_001_en.html

