

Output of Finland’s national economy grew in July to September, but demand shows signs of petering out
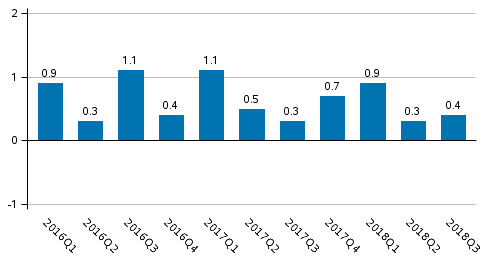
In the July to September period, the seasonally adjusted volume of Finland’s gross domestic product increased by 0.4 per cent from the previous quarter. GDP adjusted for working days grew by 2.4 per cent compared to the third quarter of 2017. Examined at current prices, gross domestic product adjusted for working days was 4.5 per cent higher than one year ago.
Figure 2. Volume change of GDP from the previous quarter, seasonally adjusted, per cent
According to preliminary data compiled by Eurostat, GDP in the EU-28 area grew by 0.3 per cent in the third quarter from the previous quarter and by 1.9 per cent from one year back.
Output
The volume of total value added generated by all industries increased by 0.5 per cent from the previous quarter and by 2.5 per cent from twelve months back.
Figure 3. Changes in the volume of value added generated by industries in the third quarter of 2018 compared to one year ago, working-day adjusted, per cent
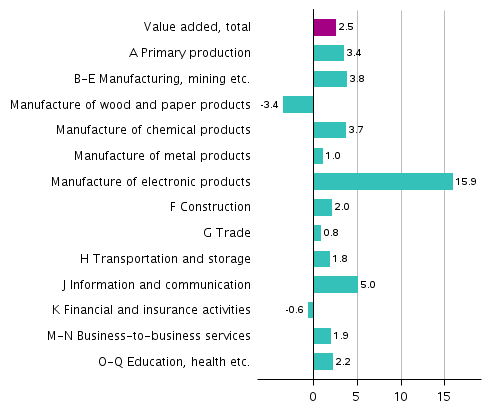
Figure 4. Changes in the volume of value added generated by industries in the third quarter of 2018 compared to the previous quarter, seasonally adjusted, per cent
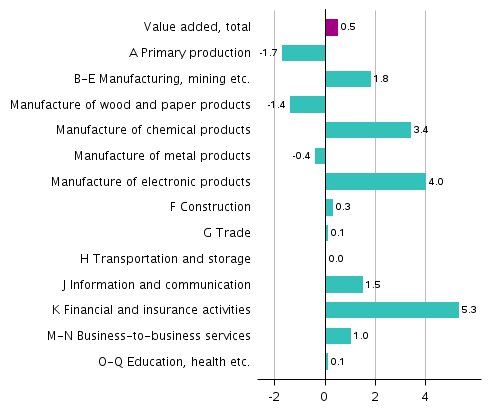
In primary production, that is, agriculture, forestry and fishing, the volume of value added grew in July to September by three per cent year-on-year but contracted by two per cent from the previous quarter. The volume of value added in agriculture declined by four per cent but forestry grew by six per cent from last year.
Output in manufacturing industries (incl. mining and quarrying, energy, water supply and waste management) grew by four per cent in July to September from one year ago and by two per cent from the previous quarter. Output in the manufacture of wood and paper products contracted by three per cent from its level one year ago. In the manufacture of chemicals and chemical products, output increased by four per cent and the volume of output in the manufacture of metal products and machinery (excl. electrical and electronics industry) grew by one per cent from twelve months earlier. The electrical and electronics industry grew in the third quarter by as much as 16 per cent from twelve months back. Adjusted for working days, output in manufacturing was in total three per cent higher than one year before.
The construction industry grew by two per cent in the July to September period from the previous year. The growth in building construction still appears to continue, but the development of civil engineering is already more subdued.
The volume of service industries grew by half a per cent from the previous quarter’s level, up by two per cent from the previous year. Compared to the third quarter of 2017, the value added of general government services grew by one per cent and that of private services by three per cent.
The volume of trade was in July to September one per cent higher than one year earlier. The strongly grown industry of motor vehicle trade still increased in the third quarter from the year before, but decreased from the previous quarter. The value added in financial intermediation and insurance activities decreased slightly from July to September 2017. Other service industries grew from one year back, but value added in accommodation and food services activities declined from the previous quarter.
Imports, exports, consumption and investments
Total demand increased in July to September by 1.4 per cent compared to the third quarter of 2017. The development of demand items was subdued, and the growth in demand is exceptionally explained by change in inventories. Inventories of manufacturing industries grew in particular.
Figure 5. Changes in the volume of main supply and demand items in the third quarter of 2018 compared to one year ago, working-day adjusted, per cent
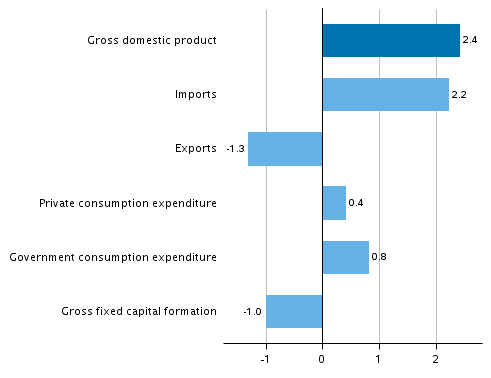
Figure 6. Changes in the volume of main supply and demand items in the third quarter of 2018 compared to one year ago, seasonally adjusted, per cent
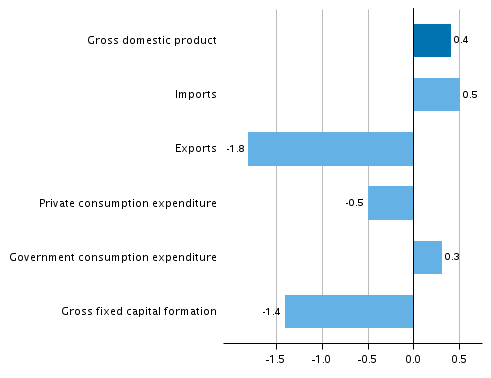
In July to September, the volume of exports decreased by two per cent from the previous quarter and by one per cent year-on-year. Compared to the third quarter of 2017, exports of goods went down by three per cent, but exports of services increased by nearly three per cent.
The volume of imports went up by two per cent from twelve months back and by half a per cent from the previous quarter. Imports of goods grew by one per cent and those of services by five per cent year-on-year.
Private consumption decreased in the third quarter by half a per cent from the previous quarter but grew by half a per cent from the corresponding quarter of one year before. Government consumption expenditure grew by one per cent from the level of the third quarter of 2017.
Gross fixed capital formation, i.e. investments contracted by one per cent from both the previous quarter and from twelve months back. Private investments decreased by two per cent but public investments grew by four per cent from one year ago. The volume of gross fixed capital formation in machinery, equipment and transport equipment contracted by 10 per cent from the third quarter of 2017. Investments in residential buildings grew by three per cent and investments in non-residential buildings by one per cent from one year ago. Investments in civil engineering contracted by nearly two per cent from the previous year's level. Investments in intellectual property products including software, research and development grew by two per cent from twelve months back.
Employment, wages and salaries and national income
In July to September, the number of employed persons increased by 0.3 per cent from the previous quarter and by 2.7 per cent year-on-year. The number of hours worked in the national economy grew by 0.8 per cent from the previous quarter and by 3.5 per cent from one year back.
According to Statistics Finland’s Labour Force Survey, the rate of unemployment for the July to September period was 6.5 per cent, while in last year’s corresponding period it was 7.7 per cent.
In July to September, the nominal wages and salaries bill of the national economy grew by 0.8 per cent from the previous quarter and by 4.4 per cent year-on-year. Social contributions paid by employers grew by 0.1 per cent from one year back.
The operating surplus (net), which in business bookkeeping corresponds roughly with operating profit, grew in the third quarter by 8.1 per cent from twelve months back. Gross national income calculated at current prices was 2.4 per cent higher than one year previously.
The available data
These preliminary quarterly data are based on the source information on economic development that had become available by 26 November 2018. The annual level data for 1990 to 2017 correspond with the National Accounts data released on 12 July 2018, except for those on the rest of the world sector (imports, exports, primary income from/to the rest of the world), which may have become revised.
Data concerning the last quarter of 2018 will be released on 28 February 2019, when the data for previous quarters will also be revised. A flash estimate on GDP development for October to December will be released in connection within the December data of the Trend Indicator of Output on 14 February 2019.
Due to the benchmarking and seasonal adjustment methods, quarterly data in the entire time series may become slightly revised in connection with each release. However, the largest revisions take place during the two to three years following the release on a quarter, because final annual accounts data are published at a lag of around two years from the end of the statistical reference year. Seasonally adjusted and trend time series always become revised against new observations irrespective of whether the original time series becomes revised or not.
The quality description can be accessed at (in Finnish): http://www.tilastokeskus.fi/til/ntp/laa.html .
Methodological description of Quarterly National Accounts.Source: National Accounts 2018, 3:rd quarter. Statistics Finland
Inquiries: Samu Hakala 029 551 3756, Antti Kosunen 029 551 3613, kansantalous.suhdanteet@stat.fi
Director in charge: Ville Vertanen
Updated 30.11.2018
Official Statistics of Finland (OSF):
Quarterly national accounts [e-publication].
ISSN=1797-9765. 3rd quarter 2018,
Output of Finland’s national economy grew in July to September, but demand shows signs of petering out
. Helsinki: Statistics Finland [referred: 6.7.2026].
Access method: http://stat.fi/til/ntp/2018/03/ntp_2018_03_2018-11-30_kat_001_en.html