

Finland's national economy in recession, output contracted in January to March
In January to March, the seasonally adjusted volume of Finland’s gross domestic product decreased by 0.9 per cent from the previous quarter. GDP adjusted for working days went down by 1.1 per cent compared to the first quarter of 2019. Examined at current prices, gross domestic product adjusted for working days was 0.1 per cent higher than one year ago.
Figure 1. Volume change of GDP from the previous quarter, seasonally adjusted, per cent
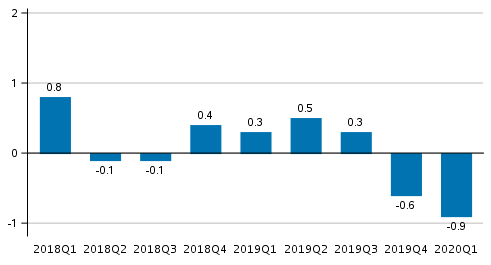
According to preliminary data compiled by Eurostat, GDP in the EU area decreased by 3.3 per cent in the first quarter from the previous quarter and by 2.6 per cent from one year back.
Output
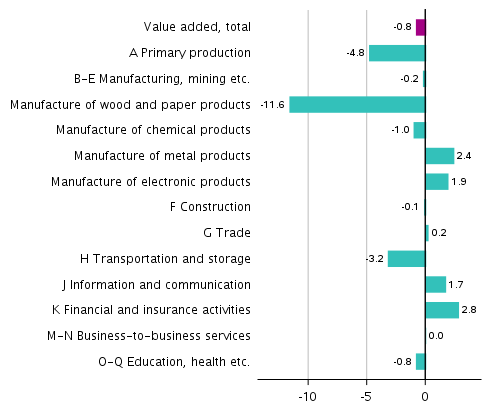
The volume of total value added generated by all industries decreased by 0.8 per cent from the previous quarter and by 1.2 per cent from twelve months back.
Figure 2. Changes in the volume of value added generated by industries in the first quarter of 2020 compared to one year ago, working day adjusted, per cent
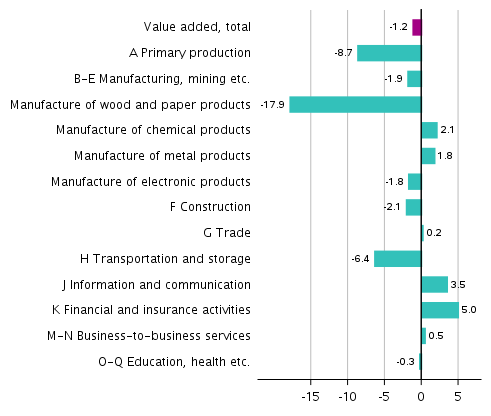
Figure 3. Changes in the volume of value added generated by industries in the first quarter of 2020 compared to the previous quarter, seasonally adjusted, per cent
The volume of value added in primary production, that is, agriculture, forestry and fishery, declined by nine per cent in January to December from one year ago. Forestry contracted by 12 per cent from one year ago.
Output in manufacturing industries (incl. mining and quarrying, energy, water supply and waste management) decreased by two per cent in January to March from one year before. The metal and chemical industries grew by two per cent from one year ago. The forest industry had a labour dispute in winter, which partly contributed to the collapse of value added to an 18 per cent lower level than one year ago. Construction declined by two per cent from the previous year.
The volume of service industries diminished by one per cent from the previous quarter. Especially transport and accommodation and food service activities already suffered from the coronavirus crisis in the first quarter. In contrast, the volume of retail trade grew in January to March from the previous year. The industries of information and communication activities, as well as financing and insurance activities also grew.
Imports, exports, consumption and investments
Total demand contracted by 2.2 per cent in January to March from one year back.
Figure 4. Changes in the volume of main supply and demand items in the first quarter of 2020 compared to one year ago, working day adjusted, per cent
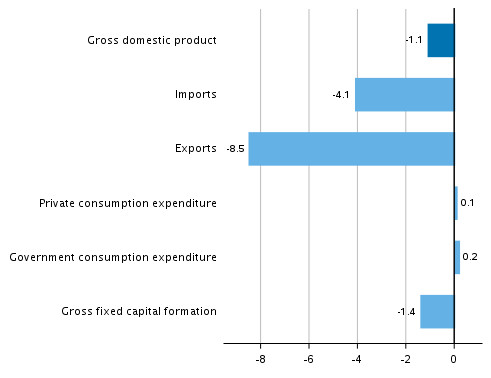
Figure 5. Changes in the volume of main supply and demand items in the first quarter of 2020 compared to the previous quarter, seasonally adjusted, per cent
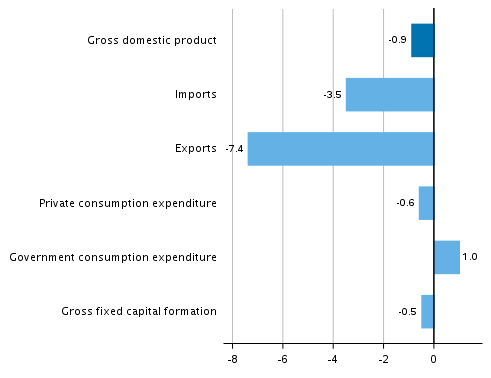
In the January to March period, the volume of exports decreased by seven per cent from the previous quarter. Compared to the first quarter of 2019, exports of goods contracted by 12 per cent but exports of services remained on level with one year back. Imports decreased by four per cent year-on-year: imports of goods decreased by five per cent and imports of services by two per cent.
Private consumption remained on level with the previous year in the first quarter but diminished from the previous quarter. Households' consumption expenditure on semi-durable goods decreased clearly, the consumption of services also diminished slightly. Government consumption expenditure increased from the previous quarter.
Gross fixed capital formation, or investments, fell by half a per cent from the previous quarter and by one-and-a-half per cent from the year before. Private investments decreased by three per cent, but public investments grew by five per cent compared with January to March 2019. The volume of investments in machinery, equipment and transport equipment decreased by five per cent from the previous year. Investments in residential buildings remained on level with the previous year but investments in non-residential buildings diminished. Investments in civil engineering grew clearly.
Employment, wages and salaries and national income
In January to March the number of employed persons grew by 0.6 per cent and that of hours worked by 0.1 per cent from one year back.
According to Statistics Finland’s Labour Force Survey, the unemployment rate was 7.1 per cent in January to March, which is the same as in the corresponding period last year.
In the January to March period, the nominal wages and salaries bill of the national economy grew by 1.0 per cent from the previous quarter and by 3.0 per cent year-on-year. Social contributions paid by employers grew by 1.9 per cent from one year back.
The operating surplus (net), which in business bookkeeping corresponds roughly with operating profit, grew in the first quarter by 3.3 per cent from twelve months back. Gross national income calculated at current prices was 1.4 per cent lower than one year previously.
The available data
These preliminary quarterly data are based on the source information on economic development that had become available by 22 May 2020. The annual level data for 1990 to 2018 correspond with the National Accounts data released on 16 March 2020, except for those on the rest of the world sector (imports, exports, primary income from/to the rest of the world), which may have become revised. More detailed data for 2019 will be published on 18 June 2020, when the quarterly accounts database tables will also be updated.
Data concerning the second quarter of 2020 will be released on 28 August 2020. A flash estimate on GDP development for April to June will be released in connection with the June data of the the Trend Indicator of Output on 14 August 2020.
Due to the benchmarking and seasonal adjustment methods, quarterly data may become slightly revised in connection with each release. However, the largest revisions take place during the two to three years following the release on a quarter, because final annual accounts data are published at a lag of around two years from the end of the statistical reference year. Seasonally adjusted and trend time series always become revised against new observations irrespective of whether the original time series becomes revised or not.
The quality description is available on Statistics Finland's website: http://www.tilastokeskus.fi/til/ntp/laa.html .
Methodological description of Quarterly National Accounts.Source: National Accounts 2020, 1st quarter. Statistics Finland
Inquiries: Samu Hakala 029 551 3756, Antti Kosunen 029 551 3613, kansantalous.suhdanteet@stat.fi
Director in charge: Jan Nokkala
Updated 29.5.2020
Official Statistics of Finland (OSF):
Quarterly national accounts [e-publication].
ISSN=1797-9765. 1st quarter 2020,
Finland's national economy in recession, output contracted in January to March
. Helsinki: Statistics Finland [referred: 29.7.2026].
Access method: http://stat.fi/til/ntp/2020/01/ntp_2020_01_2020-05-29_kat_001_en.html