

Gross domestic product grew by 3.3 per cent in 2021
The volume of gross domestic product grew by 3.3 per cent last year. Calculated at current prices, gross domestic product was 6.1 per cent higher than in 2020. In October to December, gross domestic product grew by 0.6 per cent from the previous quarter and by 2.9 per cent from one year earlier.
According to preliminary data compiled by Eurostat, GDP in the EU area grew by 0.4 per cent in the last quarter from the level in July to September and by 5.7 per cent in the whole of 2021.
Figure 1. Volume change of GDP from the previous quarter, seasonally adjusted, per cent
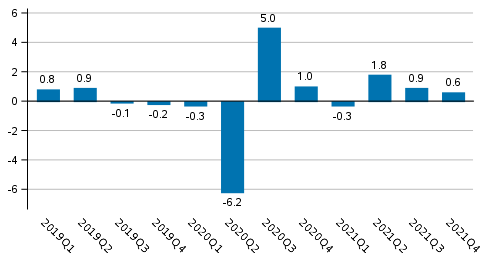
The volume of GDP decreased in the first quarter of 2021 but grew strongly starting from the second quarter, when it exceeded the level prior to the corona crisis. Nearly all industries grew, and the upwards effect of rising prices on current priced growth figures was particularly visible in manufacturing industries and international trade in goods.
Output
In October to December, the combined volume of value added generated by industries grew by 0.7 per cent from the previous quarter. In the whole of 2021, value added was 3.4 per cent higher than in the year before.
Apart from the chemical industry, manufacturing industries grew in 2021. Service industries also grew as corona restrictions were eased and the national economy recovered from the year 2020 that was particularly difficult for many industries.Figure 2. Changes in the volume of value added generated by industries in 2021 compared to one year ago, per cent
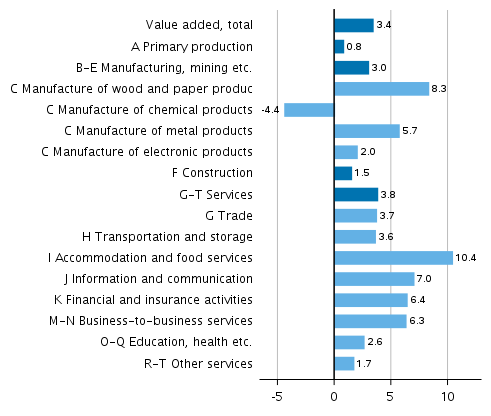
Figure 3. Year-on-year changes in the volume of value added generated by industries in the fourth quarter of 2021, working day adjusted, per cent
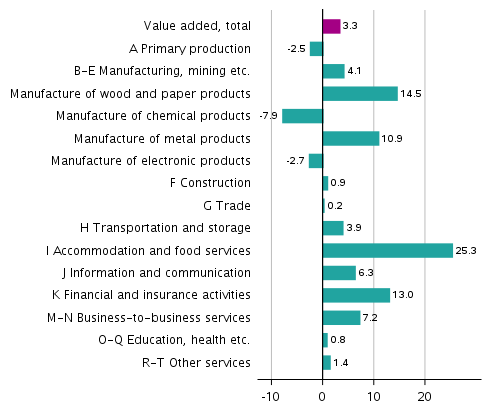
Figure 4. Changes in the volume of value added generated by industries in the fourth quarter of 2021 compared to the previous quarter, seasonally adjusted, per cent
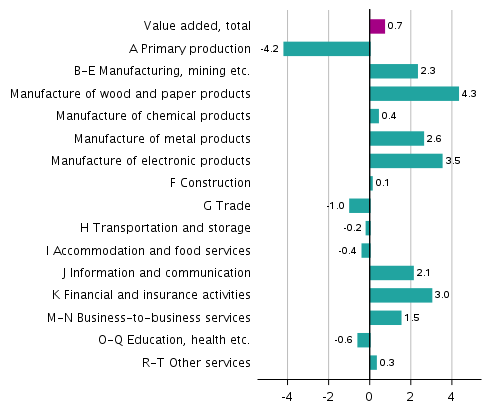
The volume of value added in primary production, that is, agriculture, forestry and fishery, decreased in October to December. In the whole of 2021, primary production grew slightly due to market fellings in forestry. Value added in agriculture diminished clearly.
Value added in industry (industries B to E) grew in the last quarter. Over the whole year 2021, manufacturing industries grew by three per cent. The volume of value added was lower in the chemical industry than in the previous year, but other branches of manufacturing grew. Prices rose clearly, which is visible as double-digit growth figures for value added at current prices in all manufacturing industries, excl. the electrical and electronic industry.
The volume of construction grew in 2021, but calculated at current prices, the volume of value added was lower than in the previous year. Building construction has grown starting from April to June, but the growth in civil engineering stayed put throughout last year.
In service industries, the volume of value added grew in 2021. The first quarter was still subdued. The growth started in April to June and continued throughout the latter part of the year. Accommodation and food service activities slowed down slightly in the October to December period as the coronavirus situation in society worsened. The volume of value added in transport and accommodation and food service activities is still good 15 per cent lower than before the onset of the coronavirus crisis.
Imports, exports, consumption and investments
In 2021, total demand in the national economy grew by 3.6 per cent from the previous year. Exports, consumption and private investments increased but government investments decreased.figure 5. Changes in the volume of main supply and demand items in 2021 compared to one year ago, per cent
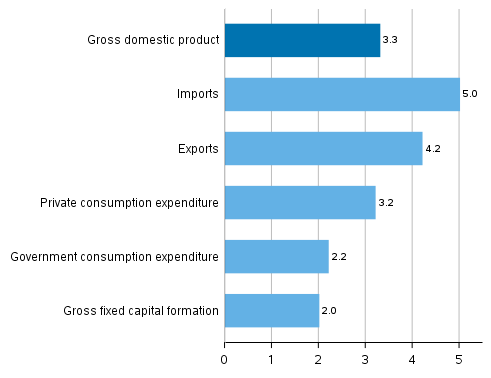
Figure 6. Year-on-year changes in the volume of main supply and demand items in the fourth quarter of 2021, working day adjusted, per cent
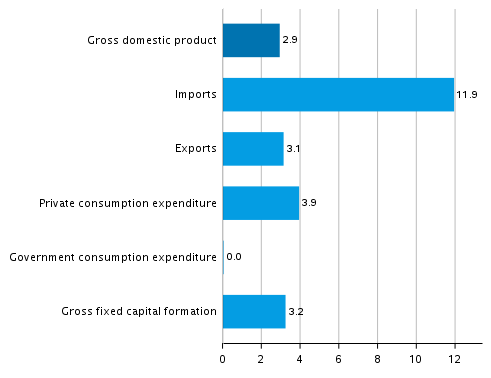
Figure 7. Changes in the volume of main supply and demand items in the fourth quarter of 2021 compared to the previous quarter, seasonally adjusted, per cent
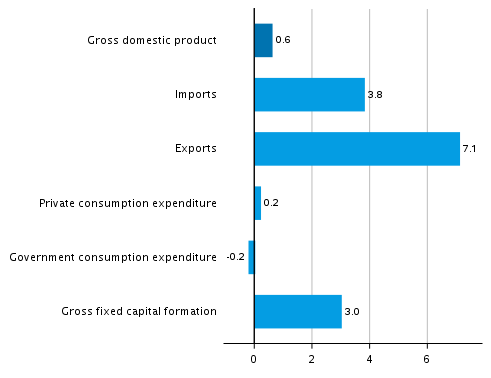
From October to December, the volume of exports increased by seven per cent from the previous quarter. Exports of goods diminished slightly but exports of services grew by as much as 25 per cent. In the whole of 2021, the volume of exports grew by four per cent and that of imports by five per cent. The rise in prices was clearly visible in the data on international trade in goods: exports and imports of goods grew by nearly 20 per cent at current prices in 2021, while the corresponding volume changes were four per cent for exports of goods and six per cent for imports.
Private consumption grew in 2021 particularly in the second and third quarters. In the whole year, private consumption expenditure increased by three per cent. The lightening of the restrictive measures was visible in growth in consumption of services and semi-durable goods, such as clothing and footwear, in the last quarter as well.
Government consumption expenditure decreased in October to December. In the whole of 2021, the volume of government consumption expenditure went up by two per cent.
The volume of gross fixed capital formation, that is, investments, grew in October to December. Over the whole year, investments increased by three per cent. Investments in residential buildings, machinery and equipment, as well as in software, research and development grew. In 2021, private investments increased by five per cent, but public investments went down by eight per cent from the previous year.
Employment, wages and salaries and national income
In October to December, the number of employed persons was 0.7 per cent higher than in the previous quarter. The number of hours worked in the national economy decreased by 0.3 per cent. In 2021, the number of employed persons grew by 2.0 per cent and the number of hours worked by 1.3 per cent from the year before. According to Statistics Finland's Labour Force Survey, the unemployment rate was 6.3 per cent in December, having been 7.4 per cent in the year before. The unemployment rate for the whole of 2021 was 7.7 per cent, as high as in the year before.
Labour productivity, or the volume of gross value added per hour worked, grew by 2.1 per cent last year.
The nominal wages and salaries sum of the national economy grew by 0.9 per cent in October to December from the previous quarter. The wages and salaries sum grew by 5.0 per cent in the whole of 2021. Social contributions paid by employers grew by 0.8 per cent from the previous quarter and by 11.7 per cent in the whole year. The large growth in social contributions from the year before is explained by the reduction in the employer’s contributions in May to December 2020. The contributions were collected as normal in 2021 and the employer’s contributions for 2022 to 2025 are raised to compensate for the temporary reduction.
The operating surplus (net), which in business bookkeeping corresponds roughly with operating profit, grew by 9.0 per cent in 2021. Gross national income was 6.3 per cent higher in nominal terms than in the previous year.
The available data
The preliminary data are based on the source information on economic development available on 21 February 2022. The annual level data for 1990 to 2020 correspond with the National Accounts data released on 28 February 2022.
The preliminary data for 2021 that contain more detailed data on general government and other sector accounts will be released on 15 March 2022. The revised data will also be updated in the database tables of the Quarterly National Accounts, but no actual statistical release of the Quarterly National Accounts will be compiled.
National Accounts for 2021 with more detailed data contents will be released on 22 June 2022.
National accounts data concerning the first quarter of 2022 will be released on 31 May 2022, when the data for previous quarters will also be revised. A flash estimate on GDP development for January to March will be released in connection with the Trend Indicator of Output on 17 May 2022.
Due to the benchmarking and seasonal adjustment methods, quarterly data in the entire time series may become slightly revised in connection with each release. However, the largest revisions take place during the two to three years following the release on a quarter, because final annual accounts data are published at a lag of around two years from the end of the statistical reference year. Seasonally adjusted and trend time series always become revised against new observations irrespective of whether the original time series becomes revised or not.
The quality description can be accessed at (in Finnish): http://www.tilastokeskus.fi/til/ntp/laa.html .
Methodological description of Quarterly National Accounts.Source: National Accounts 2021, 4th quarter. Statistics Finland
Inquiries: Samu Hakala 029 551 3756, Eljas Tuomaala 029 551 2723, kansantalous.suhdanteet@stat.fi
Head of Department in charge: Katri Kaaja
Updated 28.02.2022
Official Statistics of Finland (OSF):
Quarterly national accounts [e-publication].
ISSN=1797-9765. 4th quarter 2021,
Gross domestic product grew by 3.3 per cent in 2021
. Helsinki: Statistics Finland [referred: 22.7.2026].
Access method: http://stat.fi/til/ntp/2021/04/ntp_2021_04_2022-02-28_kat_001_en.html