Published: 5 April 2012
Wage and salary earners' pay differentials contracted further in 2010
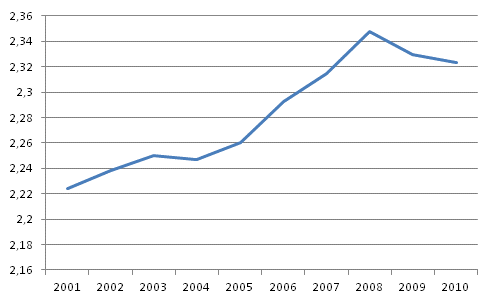
According to Statistics Finland’s Structure of Earnings statistics, the average monthly earnings of all full-time wage and salary earners were EUR 3,040 in the last quarter of 2010 and the median 1) earnings were EUR 2,715. The earnings of the best paid tenth (9th decile) of wage and salary earners exceeded EUR 4,498 while the lowest paid tenth (1st decile) earned less than EUR 1,937 per month. Thus, the best paid decile earned at least 2.32 times more than the decile with the lowest earnings. The difference in earnings between the highest and the lowest decile grew by around three percentage points from the previous year.
Pay differential of full-time wage and salary earners in Finland in the 2000s

Wage and salary earners’ pay differentials have been growing in the 2000s but the difference in their earnings has been contracting since 2008. The main reason for the observed contraction in the pay differentials was accelerated development of earnings among low-paid wage and salary earners in 2010. The earnings of the highest paid decile rose by 2.1 per cent in the year while at the same time the earnings of the lowest paid decile went up by 2.4 per cent.
Pay differential of full-time wage and salary earners in Finland in the 2000s by employer sector
| Year | Wage differences (D9/D1) | |||
| Total | Private sector | Local government | Central government | |
| 2001 | 2,224 | 2,272 | 2,044 | 2,250 |
| 2002 | 2,238 | 2,273 | 2,041 | 2,270 |
| 2003 | 2,249 | 2,300 | 2,034 | 2,278 |
| 2004 | 2,247 | 2,308 | 2,027 | 2,268 |
| 2005 | 2,259 | 2,320 | 2,052 | 2,232 |
| 2006 | 2,292 | 2,369 | 2,050 | 2,260 |
| 2007 | 2,315 | 2,401 | 2,058 | 2,254 |
| 2008 | 2,348 | 2,431 | 2,074 | 2,273 |
| 2009 | 2,329 | 2,412 | 2,064 | 2,28 |
| 2010 | 2,323 | 2,395 | 2,065 | 2,218 |
Compared to the same time period of the previous year, pay differentials contracted most among wage and salary earners in the central government sector. In 2010, the pay differential was the smallest in the local government sector where the highest paid decile of wage and salary earners earned 2.07 times more than the lowest paid decile.
These data derive from Statistics Finland’s Structure of Earnings statistics, which cover all employer sectors. Monthly earnings for total hours worked are only calculated for full-time wage and salary earners. Besides earnings for regular working hours, the earnings also include pay for any possible overtime and working hour supplements but not one-off performance-based bonuses.
1) Fifty per cent of wage and salary earners earn more and fifty per cent less than the median earnings.
Source: Structure of Earnings 2010, Statistics Finland
Inquiries: Mika Idman 09 1734 3445, Jukka Pitkäjärvi 09 1734 3356, palkkarakenne@stat.fi
Director in charge: Kari Molnar
Publication in pdf-format (254.5 kB)
- Reviews
- Tables
-
Tables in databases
Pick the data you need into tables, view the data as graphs, or download the data for your use.
Appendix tables
Updated 5.4.2012
Official Statistics of Finland (OSF):
Structure of Earnings [e-publication].
ISSN=1799-0092. 2010. Helsinki: Statistics Finland [referred: 21.12.2025].
Access method: http://stat.fi/til/pra/2010/pra_2010_2012-04-05_tie_001_en.html?ad=notify

