Published: 8 April 2015
Highest average earnings in information and communication activities in 2013
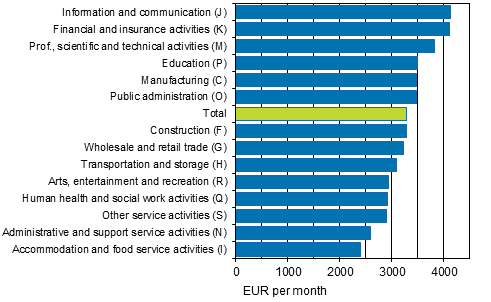
According to Statistics Finland’s Structure of Earnings statistics, the average total earnings for fixed-term wage and salary earners in full-time employment were EUR 3,284 per month in 2013. The highest average earnings were in information and communication activities (EUR 4,124). The average earnings were lowest in accommodation and food service activities (EUR 2,399). Besides earnings for regular working hours, total earnings also include all bonuses and benefits in kind, but not one-off pay items, such as performance-based bonuses.
Average total earnings of full-time wage and salary earners in key industries (Standard Industrial Classification 2008) in 2013

The level of average earnings in information and communication activities is explained by the enterprise and occupational structure. The industry mainly consists of corporations in the media and software industry. The most common occupations in the industry include application analysts, IT support personnel, sales representatives, and magazine, radio and TV journalists. Within the industry, the highest average earnings were found in the sub-industries software publishing (EUR 5,160) and computer programming, consultancy and related activities (EUR 4,273). The lowest average earnings were in the sub-industries sound recording and music publishing (EUR 3,686) and publishing of magazines and books (EUR 3,688).
Smallest dispersion of earnings in accommodation and food service activities
The variation in total earnings was smallest in accommodation and food service activities, where ten per cent of full-time wage and salary earners earned less than EUR 1,820 per month (1st decile). Ten per cent of the full-time wage and salary earners working in the industry earned more than EUR 3,108 per month (9th decile). The median earnings were EUR 2,228: one-half of the full-time wage and salary earners in the industry earned more and one-half less than this.
The largest variation in earnings was found in financing and insurance activities, where the difference in total earnings between the first and ninth decile was 2.8-fold. The corresponding figure for total industries was 2.3 and for accommodation and food service activities 1.7.
Total earnings in the 9th decile were highest in financing and insurance activities: EUR 6,593. Most performance-based bonuses in relative terms are paid in financing and insurance, which are not, however, included in total earnings.
The wage and salary earners with the lowest earnings worked in administrative and support service activities and other service activities. In administrative and support service activities, ten per cent of full-time employees earned under EUR 1,701 per month while the corresponding sum in other service activities was EUR 1,753. High numbers of helpers and cleaners work in both industries.
Indicators of total earnings of full-time wage and salary earners by industry in 2013
| Industry (Standard Industrial Classification 2008) | Number of wage and salary earners | Total earnings, EUR/month | ||
| 1st decile | Median | 9th decile | ||
| Total | 1 388 996 | 2 081 | 2 928 | 4 861 |
| Mining and quarrying (B) | 3 874 | 2 439 | 3 370 | 4 770 |
| Manufacturing (C) | 234 700 | 2 282 | 3 163 | 4 999 |
| Electricity, gas, steam and air conditioning supply (D) | 10 062 | 2 590 | 3 590 | 5 625 |
| Water supply; sewerage, waste management and remediation activities (E) | 7 571 | 2 170 | 2 844 | 4 378 |
| Construction (F) | 91 826 | 2 278 | 3 053 | 4 500 |
| Wholesale and retail trade (G) | 140 973 | 1 984 | 2 712 | 5 099 |
| Transportation and storage (H) | 66 506 | 2 205 | 2 820 | 4 300 |
| Accommodation and food service activities (I) | 36 614 | 1 820 | 2 228 | 3 108 |
| Information and communication (J) | 63 397 | 2 603 | 3 852 | 5 894 |
| Financial and insurance activities (K) | 35 844 | 2 373 | 3 372 | 6 593 |
| Real estate activities (L) | 11 242 | 2 016 | 3 014 | 5 424 |
| Professional, scientific and technical activities (M) | 76 451 | 2 257 | 3 412 | 5 837 |
| Administrative and support service activities (N) | 63 553 | 1 701 | 2 320 | 3 694 |
| Public administration (O) | 108 732 | 2 273 | 3 139 | 5 139 |
| Education (P) | 121 016 | 2 160 | 3 444 | 4 769 |
| Human health and social work activities (Q) | 261 529 | 2 059 | 2 612 | 3 718 |
| Arts, entertainment and recreation (R) | 20 468 | 2 038 | 2 611 | 4 083 |
| Other service activities (S) | 30 421 | 1 753 | 2 579 | 4 408 |
Apart from earnings for regular working hours, total earnings also include pay for any possible overtime and working hour supplements, premium pays, supplement for location and adverse working conditions, supplements based on duties, professional skill and years of service, performance-based pay components, compensation for standby and on-call work, pay paid for hours not worked and benefits in kind. Total earnings do not include one-off pay items, such as performance-based bonuses.
Source: Structure of Earnings 2013, Statistics Finland
Inquiries: Sampo Pehkonen 029 551 3452, Jukka Pitkäjärvi 029 551 3356, palkkarakenne@stat.fi
Director in charge: Hannele Orjala
Publication in pdf-format (220.2 kB)
- Tables
-
Tables in databases
Pick the data you need into tables, view the data as graphs, or download the data for your use.
Appendix tables
Updated 8.4.2015
Official Statistics of Finland (OSF):
Structure of Earnings [e-publication].
ISSN=1799-0092. 2013. Helsinki: Statistics Finland [referred: 22.2.2026].
Access method: http://stat.fi/til/pra/2013/pra_2013_2015-04-08_tie_001_en.html

