Published: 6 April 2017
Median earnings of wage and salary earners highest in information and communication
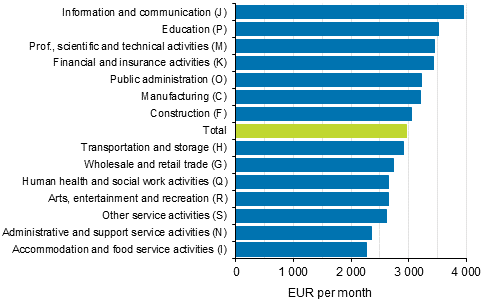
According to Statistics Finland’s Structure of Earnings statistics, the median of total earnings of full-time wage and salary earners was EUR 2,963 per month in 2015. The median earnings were highest, EUR 3,944, in information and communication activities. Besides basic pay, total earnings include all bonuses, overtime pay and benefits in kind, but not performance-based bonuses or holiday bonuses. Total earnings are in gross.
Median of total earnings of full-time wage and salary earners in key industries (Standard Industrial Classification 2008) in 2015

The median earnings were lowest in the industry of accommodation and food service activities. The median of total earnings of full-time wage and salary earners was EUR 2,268 per month in the industry. Part-time employees made up 38 per cent of all wage and salary earners in accommodation and food service activities. If part-time employees are taken into account, the median of total earnings in the industry was EUR 2,004 per month in 2015.
The median refers to the middle observation of an arranged group. One-half of the group being observed (e.g. wage and salary earners in accommodation and food service activities) earn more and one-half less than the median. A full-time wage and salary earner refers to a worker who has worked a full working week throughout the statistical reference month.
The industry is determined according to the main activity of the wage and salary earner's workplace. For instance, the industry of construction (F) includes all wage and salary earners working in the field from salaried employees to workers. For further information about the Standard Industrial Classification, see http://www.stat.fi/meta/luokitukset/toimiala/001-2008/index_en.html
Most professionals work in the industries of information and communication and education
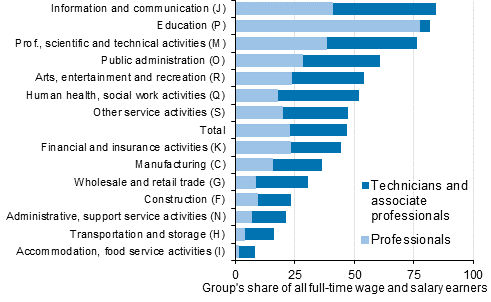
In 2015, the share of professionals and technicians and associate professionals in all wage and salary earners in the industry was largest in the industries of information and communication activities, education, and professional, scientific and technical activities. In these industries the median of total earnings was also highest.
The occupational structure of wage and salary earners is a key factor explaining differences in earnings between industries. The total earnings of professionals and technicians and associate professionals are larger, on average, in all industries than those of others working in non-management occupational groups.
In the industry of information and communication, where in 2015 mainly media and software enterprises operated, professionals and technicians and associate professionals covered in all 84 per cent of all full-time wage and salary earners in the field. The most common associate professional occupations in the industry were such as systems analysts, IT support personnel, user support technicians, operations technicians, journalists, and radio and TV journalists.
The share of professionals was largest in the industry of education, where 77 per cent of all full-time wage and salary earners belonged to this occupational group. Professionals working in education were teachers of universities, vocational schools and colleges, upper secondary general schools, comprehensive schools and day care centres.
Share of professionals and technicians and associate professionals in all full-time wage and salary earners in the industry (Standard Industrial Classification 2008) in 2015

Professionals include wage and salary earners who work in demanding expert tasks or in supervisor and head level tasks. The skill level of technician and associate professional tasks is lower, but as for professionals, their job description includes the application of technological, scientific, artistic, administrative or business expertise. For further information about the classification of occupations, see http://stat.fi/meta/luokitukset/ammatti/001-2010/index_en.html
Earnings of technicians and associate professionals vary by industry
The occupational structure has an effect on the earnings level of the whole industry. Those industries, where the share of professionals and technicians and associate professionals in wage and salary earners is big, typically have higher median earnings than other industries. But in which fields do professionals and technicians and associate professionals earn most?
The comparison by industry turns upside down when we view the median earnings of professionals and technicians and associate professionals only instead of all workers in the industry. For example, when examining all wage and salary earners, the median earnings of wage and salary earners in education were the second highest, but the median earnings of professionals in education (EUR 3,683 per month) were below the median of all professionals (EUR 3,946 per month).
In 2015, professionals earned most in the industry of financing and insurance activities. The median of total earnings was EUR 4,868 per month. In trade, the corresponding earnings of professionals were EUR 4,785 per month. The lowest median earnings of professionals, EUR 3,008 per month, were in the industry of arts, entertainment and recreation activities.
Professionals do not form a uniform group, but typical professional occupations vary by industry. For example, professionals’ tasks in manufacturing are focused on engineering-type tasks, such as product development, planning and manufacturing and applications design.
In the industry of financial and insurance activities, the typical tasks vary from financial and investment advisory services to accounting activities and applications design. Correspondingly, typical professional occupations in the industry of arts, entertainment and recreation activities are librarians, actors and musicians.
Median of total earnings of full-time wage and salary earners by industry and occupational group in 2015, EUR per month
| Industry | Professionals | Technicians and associate professionals | Other occupational groups, excl. managers |
| Manufacturing (C) | 4 572 | 3 554 | 2 806 |
| Construction (F) | 4 290 | 3 520 | 2 868 |
| Wholesale and retail trade (G) | 4 785 | 3 519 | 2 394 |
| Transportation and storage (H) | 4 558 | 3 460 | 2 781 |
| Accommodation and food service activities (I) | 3 414 | 2 719 | 2 220 |
| Information and communication (J) | 4 365 | 3 631 | 2 792 |
| Financial and insurance activities (K) | 4 868 | 4 194 | 2 770 |
| Prof., scientific and technical activities (M) | 4 250 | 3 210 | 2 468 |
| Administrative and support service activities (N) | 3 735 | 2 968 | 2 182 |
| Public administration (O) | 3 960 | 2 942 | 2 867 |
| Education (P) | 3 683 | 2 683 | 2 194 |
| Human health and social work activities (Q) | 3 322 | 2 802 | 2 383 |
| Arts, entertainment and recreation (R) | 3 008 | 2 652 | 2 370 |
| Other service activities (S) | 3 572 | 2 759 | 2 145 |
| Total | 3 946 | 3 146 | 2 540 |
The group of other occupational groups, excl. managers, consists of other main groups of the Classification of Occupations 2010. The group includes clerical support workers, service and sales workers, craft and related trades workers, plant and machine operators, and assemblers, elementary occupations, and armed forces. In this combined group, the median of total monthly earnings did not exceed EUR 3,000 in any industry in 2015.
The Structure of Earnings statistics for 2015 provide data on the earnings of around 1.6 million wage and salary earners. The data in the statistics are collected from monthly-paid wage and salary earners for September, October or November, and from hourly-paid wage and salary earners for the last quarter of the year. This publication supplements the preliminary data on Structure of Earnings statistics released on 29 September 2016 with industry and region-specific earnings data.
The Structure of Earnings statistics measure total earnings. Apart from basic pay, total earnings also include pay for personal supplements, premium pays, supplement for location and adverse working conditions, supplements based on duties, professional skill and years of service, performance-based pay components, partly compensation for standby and on-call work, pay paid for hours not worked, overtime and working hour supplements, and benefits in kind. Total earnings do not include one-off pay items, such as performance-based bonuses and holiday bonuses.
Source: Structure of Earnings 2015, Statistics Finland
Inquiries: Sampo Pehkonen 029 551 3452, Jukka Pitkäjärvi 029 551 3356, palkkarakenne@stat.fi
Director in charge: Mari Ylä-Jarkko
Publication in pdf-format (237.3 kB)
- Tables
-
Tables in databases
Pick the data you need into tables, view the data as graphs, or download the data for your use.
Appendix tables
Updated 6.4.2017
Official Statistics of Finland (OSF):
Structure of Earnings [e-publication].
ISSN=1799-0092. 2015. Helsinki: Statistics Finland [referred: 4.2.2026].
Access method: http://stat.fi/til/pra/2015/pra_2015_2017-04-06_tie_001_en.html

