Published: 21 September 2017
Most common monthly earnings of full-time wage and salary earners EUR 2,500 in 2016
According to Statistics Finland’s Structure of Earnings statistics, the most common total earnings of full-time wage and salary earners were EUR 2,500 per month in 2016. Besides basic pay, total earnings include all bonuses, overtime pay and benefits in kind, but not performance-based bonuses or holiday bonuses. Total earnings are in gross, so taxes or other payments have not been subtracted from them.
Distribution of total earnings of full-time wage and salary earners in 2016
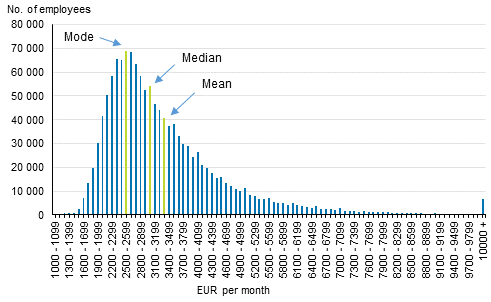
The Structure of Earnings statistics describe wage and salary earners working in enterprises with more than five employees in the public and private sectors. The figure above shows the number of full-time wage and salary earners by total earnings.
In the figure, total earnings have been divided into categories of EUR one hundred. Most wage and salary earners are found in the category EUR 2,500 to 2,599, around 69,000 persons. This is the most common (mode) earnings category. Typical occupational groups for those earning EUR 2,500 to 2,599 per month were, e.g. nurse, early childhood educator and building worker.
The median of total earnings of full-time wage and salary earners was EUR 3,001 per month. One-half of full-time wage and salary earners earned less than this, one half earned more.
The average of total earnings was EUR 3,368 per month. Sixty-three per cent of full-time wage and salary earners earned less than the average. This is explained by the fact that high total earnings increase the average.
A full-time wage and salary earner refers to an employee who has worked a full working week throughout the statistical reference month.
Highest median earnings among those aged 40 to 44
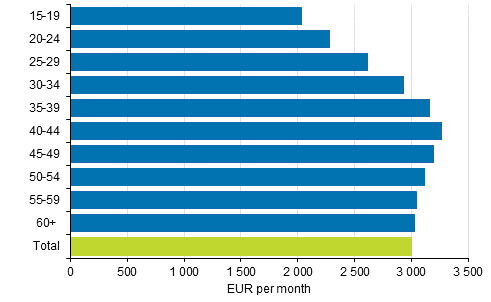
In 2016, full-time wage and salary earners in their forties had the highest median earnings. The highest median of total earnings was found in the age group 40 to 44, EUR 3,267 per month. In older age groups than this, the median of total earnings was slightly lower
Young people had the lowest median earnings. In the age group 15 to 19, the median of total earnings was EUR 2,030 per month, and in the age group 20 to 24, the corresponding earnings were EUR 2,279 per month. The number of wage and salary earners was also lowest in these age groups.
Median of total earnings of full-time wage and salary earners by age group in 2016
People in their forties more often in management, professional and associate professional tasks
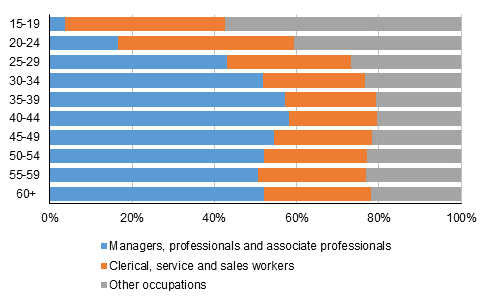
One reason for the higher earnings among those aged over 40 is that they worked in management, professional and associate professional tasks more often than others. The earnings level in management, professional and associate professional tasks is, on average, higher than for other occupational groups.
In 2016, fifty-eight per cent of full-time wage and salary earners aged 40 to 44 worked in management, professional and associate professional tasks. The corresponding share for persons aged 20 to 24 was 17 per cent and for those aged over 60 it was 52 per cent.
It is descriptive that for those aged 40 to 44, the most common occupational group was nurses, which is classified as an associate professional task. In the age group 20 to 24, the most common occupational group was shop sales assistants, and for those aged over 60 it was office cleaners.
Percentage shares of occupational groups by age group in 2016
For persons in management and professional tasks total earnings improve still in the fifties
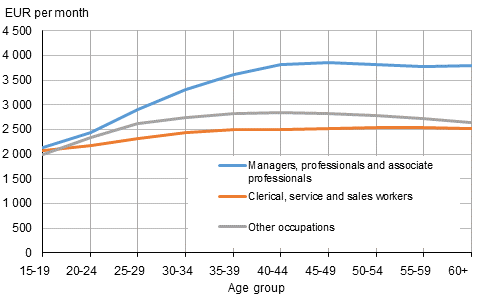
When examining the earnings of all full-time wage and salary earners working in management, professional and associate professional tasks by age group, it is found that the median earnings were higher for those aged over 40 than for those aged under 40. For example, the median earnings of those aged 40 to 44 were 31 per cent higher than for those aged 25 to 29.
The total earnings of the occupational group managers, professionals and associate professionals do not grow much after the age of forty. This is explained by that managers and professionals of different ages partially work in different types of tasks. For example, those aged 40 to 44 more often work in technical and financial professional tasks than those in older age groups.
If the internal occupational structure (the most detailed level of the Classification of Occupations 2010) of managers, professionals and associate professionals is considered, the earnings level grew until about the age of 55.
Median of total earnings of full-time wage and salary earners by age group and occupational group in 2016
Index of total earnings by age, constant occupational structure, full-time employees, year 2016
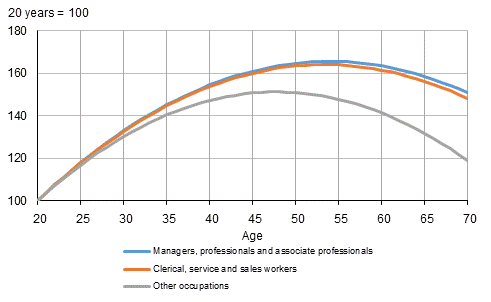
In other employee groups, the link between the age and the earnings level is not as strong. For clerical support workers, service and sales workers the median of total earnings of those aged 40 to 44 was eight per cent higher than the median earning of persons aged 25 to 29. The corresponding difference in other occupational groups was nine per cent.
It is noteworthy that in other occupational groups the average median earnings were lower for those aged over 45 than for 40 to 44 year-olds. This is explained by the occupational structure. Persons aged over 45 worked in low-paid occupations, like cleaners, more often than those aged under 45. In addition, less shift and overtime work is performed in the older age groups.
In the examination, other occupational groups include the following main groups of the Classification of Occupations 2010: 6 Skilled agricultural, forestry and fishery workers, 7 Craft and related trades workers, 8 Plant and machine operators, and assemblers, and 9 Elementary occupations.
The final version of Structure of Earnings to be published in April 2008
The preliminary Structure of Earnings statistics for 2016 provide data on the earnings of around 1.6 million wage and salary earners. The data in the statistics are collected from monthly-paid wage and salary earners for September, October or November, and from hourly-paid wage and salary earners for the last quarter of the year. The Structure of Earnings statistics do not include the top management of private sector enterprises.
The data of the preliminary Structure of Earnings statistics will become revised in terms of level and field of education in the final release of 2016 data in April 2018. At that point, the statistics will also be complemented with data concerning industry and location.
The Structure of Earnings statistics measure total earnings. Apart from basic pay, total earnings also include pay for personal supplements, premium pays, supplement for location and adverse working conditions, supplements based on duties, professional skill and years of service, performance-based pay components, partly compensation for standby and on-call work, pay paid for hours not worked, overtime and working hour supplements, and benefits in kind. Total earnings do not include one-off pay items, such as performance-based bonuses and holiday bonuses.
Source: Structure of Earnings 2016, Statistics Finland
Inquiries: Sampo Pehkonen 029 551 3452, Jukka Pitkäjärvi 029 551 3356, palkkarakenne@stat.fi
Director in charge: Sami Saarikivi
Publication in pdf-format (239.3 kB)
- Tables
-
Tables in databases
Pick the data you need into tables, view the data as graphs, or download the data for your use.
Appendix tables
Updated 21.9.2017
Official Statistics of Finland (OSF):
Structure of Earnings [e-publication].
ISSN=1799-0092. 2016. Helsinki: Statistics Finland [referred: 20.2.2026].
Access method: http://stat.fi/til/pra/2016/pra_2016_2017-09-21_tie_001_en.html

