Published: 11 March 2021
Wages and salaries higher in Uusimaa than elsewhere in the country
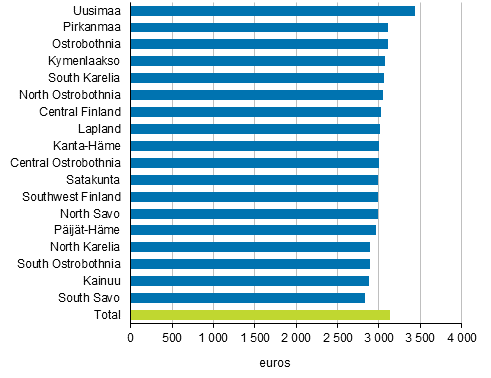
According to Statistics Finland’s Structure of Earnings statistics, the median for total earnings of full-time wage and salary earners was EUR 3,139 per month in 2019. Of the regions, median earnings were highest in Uusimaa, EUR 3,441. Median earnings were lowest in South Savo, EUR 2,829. Besides earnings for regular working hours, total earnings also include all bonuses and benefits in kind, but not one-off pay items such as performance bonuses or holiday bonuses.
Medians for total earnings of full-time wage and salary earners by region in 2019

Distribution of wages and salaries is bigger in Uusimaa than in other regions
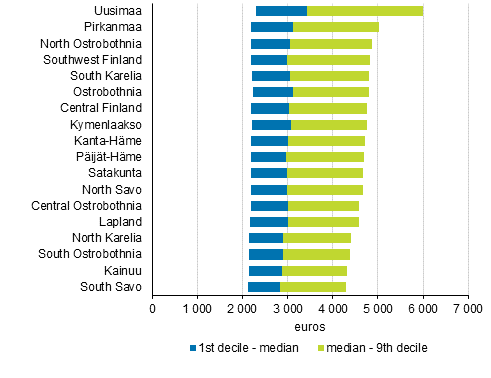
The earnings of the highest earning decile (9th decile) in Uusimaa are clearly higher than in other regions. The highest earning decile earned EUR 6,000 or more in Uusimaa while in the other regions the earnings of the highest decile were EUR 4,747 or more. The earnings of the lowest earning decile (1st decile) in Uusimaa do not differ as much from the corresponding earnings level in other regions. In Uusimaa 10 per cent of full-time wage and salary earners earned EUR 2,301 or less, while in the rest of the country the lowest decile earned EUR 2,187 or less.
Distribution of monthly total earnings of full–time wage and salary earners: 1st and 9th deciles by region in 2019

In the whole country the lowest decile earned EUR 2,222 or less and the highest decile EUR 5,238 or more.
As a result of the bigger dispersion of wages and salaries, pay differentials are much bigger in Uusimaa than in other regions. In Uusimaa the highest earning decile earned at least 2.6 times more than the lowest earning decile. In other regions, the corresponding pay differential varied from 2.3 in Pirkanmaa to 2.0 in South Savo, Kainuu and North Karelia.
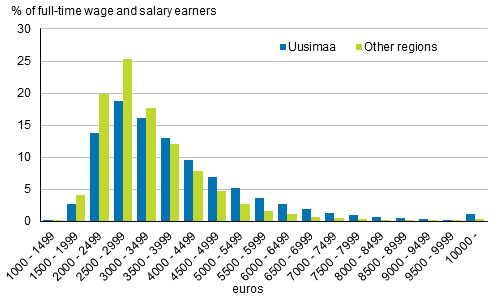
In both Uusimaa and other regions, the most common monthly earnings of full-time wage and salary earners were between EUR 2,500 and 2,999. In other regions than Uusimaa, earnings were more common in relative terms in this bracket and in the bracket below (EUR 2,000 to 2,499), while wages and salaries from EUR 3,500 up were more common in Uusimaa than in the rest of the country.
Relative shares of wage and salary earners by bracket (total earnings/month) in Uusimaa and other regions in 2019, full-time wage and salary earners

Differences in average earnings and dispersion of earnings between regions are partly caused by differences in the structures of wage and salary earners between regions. More people work in professional occupations in Uusimaa than in other regions. In Uusimaa, around 30 per cent of wage and salary earners worked in professional occupations, while in other regions the share was around 20 per cent. In these occupational groups the earnings level was on average higher than in other occupations. In relative terms, more wage and salary earners in Uusimaa also had tertiary level qualifications than in other regions.
The top management of private sector enterprises is excluded from the Structure of Earnings statistics. This may alleviate the pay differentials described in the statistics relative to actual pay differentials especially in Uusimaa.
Median earnings of wage and salary earners highest in information and communication
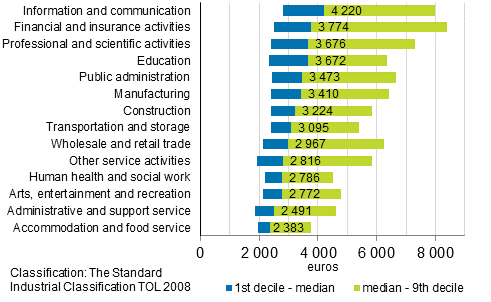
Among the industries, the highest median earnings were recorded in information and communication activities, EUR 4,220. The median of total earnings of full-time wage and salary earners was lowest in accommodation and food service activities, EUR 2,383. The industry is determined according to the main activity of the wage and salary earner's workplace.
The differences in earnings between industries are influenced, for example, by the occupational structure of wage and salary earners. The vast majority of wage and salary earners in the industry of accommodation and food service activities were service and sales workers, who typically have lower pay than those employed in associate professional and professional occupations, many of whom work in financing and insurance activities, for example.
Distribution of monthly total earnings of full-time wage and salary earners: 1st and 9th deciles by industry in 2019. Median earnings in numbers in the figure.

Among the industries, the largest variation in wages and salaries can be found in financial and insurance activities, where the earnings of the lowest decile were EUR 2,507 and those of the highest decile EUR 7,111. In the industry of financing and insurance activities, the ratio of earnings of the 9th decile to earnings of the 1st decile was 2.8, while in other industries it fluctuated from 2.5 in trade to 1.7 in accommodation and food service activities and to 1.8 in human health and social work activities.
The data in the release derive from Statistics Finland's Structure of Earnings statistics. The Structure of Earnings statistics for 2019 provide data on the earnings of around 1.4 million full-time wage and salary earners and altogether 1.69 million full-time and part-time wage and salary earners. The Structure of Earnings statistics describe all wage and salary earners for the public sector and those working in enterprises with more than five employees for the private sector.
The earnings data released in the statistics are total earnings. Apart from earnings for regular working hours, total earnings also include pay for any possible overtime and working hour supplements, premium pays, supplement for location and adverse working conditions, supplements based on duties, professional skill and years of service, performance-based pay components, compensation for standby and on-call work and benefits in kind, but not one-off pay items, such as performance-based bonuses. Total earnings are in gross, so taxes or other payments have not been subtracted from them.
Source: Structure of Earnings 2019, Statistics Finland
Inquiries: Hanna Jokimäki 029 551 3333, Hanna Ahtonen 029 551 3536, palkkarakenne@stat.fi
Head of Department in charge: Hannele Orjala
Publication in pdf-format (246.4 kB)
- Tables
-
Tables in databases
Pick the data you need into tables, view the data as graphs, or download the data for your use.
Appendix tables
Updated 11.3.2021
Official Statistics of Finland (OSF):
Structure of Earnings [e-publication].
ISSN=1799-0092. 2019. Helsinki: Statistics Finland [referred: 4.2.2026].
Access method: http://stat.fi/til/pra/2019/pra_2019_2021-03-11_tie_001_en.html

