Published: 27 August 2014
Cubic volume covered by granted building permits declined by 11 per cent in the second quarter
According to the preliminary data of Statistics Finland's statistics on building and dwelling production, in the second quarter of 2014, building permits were granted for a total of 10.7 million cubic metres, which is 10.9 per cent less than one year ago. The cubic volume covered by building permits granted for residential buildings went down by 0.4 per cent.
Building permits granted and building starts, mil. m3, variable annual sum

In the release the data indicated with an asterisk (*) are preliminary data.
Number of building permits granted was six per cent lower in June than one year previously
In June 2014, building permits were granted for a total of 3.7 million cubic metres. Their number fell by 6.1 per cent from the previous year.
The cubic volume covered by permits for residential buildings grew by 6.8 per cent. The cubic volume covered by permits granted for other than residential buildings fell by 9.8 per cent from one year ago.
Volume of newbuilding decreased by 5 per cent in June
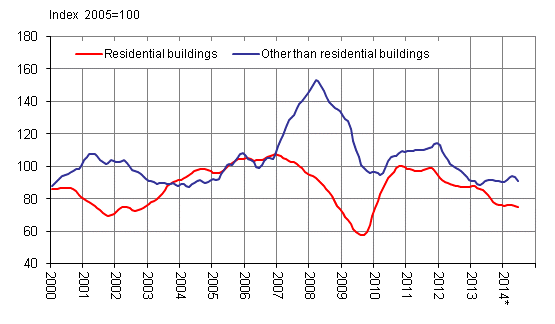
In June 2014, the constant-price value or the volume of ongoing building production decreased by 5.3 per cent year-on-year.
The volume of residential building construction decreased by 11.5 per cent in June. The volume of other than residential building construction went up slightly, by 0.3 per cent from one year ago.
Volume index for newbuilding 2005=100, trend

Source: Building and dwelling production, Statistics Finland
Inquiries: Heli Suonio 029 551 2481, Merja Järvinen 029 551 2458
Director in charge: Hannele Orjala
Publication in pdf-format (379.7 kB)
- Tables
-
Tables in databases
Pick the data you need into tables, view the data as graphs, or download the data for your use.
Appendix tables
- Appendix table 1. Building permits, 1000 m3 (27.8.2014)
- Appendix table 2. Building permits monthly, 1000 m3 (27.8.2014)
- Appendix table 3. Building permits for dwellings, No. (27.8.2014)
- Appendix table 4. Building permits by region (27.8.2014)
- Appendix table 5. Volume index of newbuilding 2005=100 (27.8.2014)
- Appendix table 6. Newbuilding 2. quarter, 2014*, mil. m3 (27.8.2014)
- Appendix table 7. Building permits, mil. m3 (27.8.2014)
- Appendix table 8. Building starts, mil. m3 (27.8.2014)
- Appendix table 9. Building completions, mil. m3 (27.8.2014)
- Appendix table 10. Volume index of newbuilding 2005=100 (27.8.2014)
- Appendix table 11. Dwelling construction by building type 2005-2014, number, building permits and building starts (27.8.2014)
- Appendix table 12. Dwelling constructions by building type 2005-2014, number, buildings under construction and building completions (27.8.2014)
- Appendix table 13. Distribution of hours worked by professional construction workers in building construction, mil. hours (27.8.2014)
- Figures
-
- Appendix figure 1. Housing production, sliding annual sum (27.8.2014)
- Appendix figure 2. Office and commercial buildings, sliding annual sum (27.8.2014)
- Appendix figure 3. Industrial buildings and warehouses, sliding annual sum (27.8.2014)
- Appendix figure 4. Volume index for newbuilding 2005=100, annual change % (27.8.2014)
- Revisions in these statistics
-
- Revisions in these statistics (27.8.2014)
Updated 27.8.2014
Official Statistics of Finland (OSF):
Building and dwelling production [e-publication].
ISSN=1798-9590. June 2014. Helsinki: Statistics Finland [referred: 17.2.2026].
Access method: http://stat.fi/til/ras/2014/06/ras_2014_06_2014-08-27_tie_001_en.html

