Published: 23 June 2015
Cubic volume covered by granted building permits declined by 5.5 per cent year-on-year in February to April
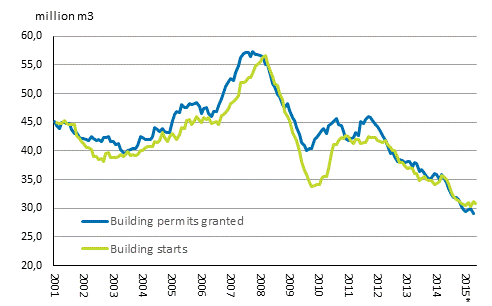
According to Statistics Finland's estimated data, in February to April 2015 building permits were granted for a total of 8.3 million cubic metres, which is 5.5 per cent less than one year ago. At the same time, 10.2 per cent fewer building projects were started than last year and the constant-price volume of building production still remained 12 per cent lower than one year ago. The data are based on Statistics Finland’s estimated statistics on building and dwelling production, in the compilation of which the data for 2015 have been corrected by statistical methods based on the data for the previous year.
Building permits granted and building starts, mil. m3, moving annual total

*) The data are based on estimation
Number of granted building permits was 17 per cent lower in 2014 than one year before
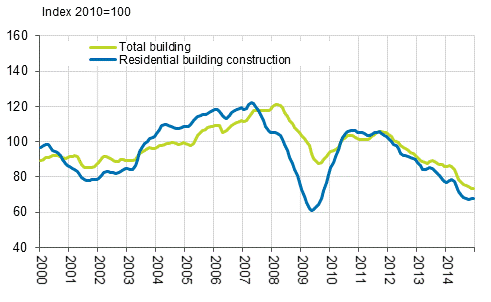
Statistics production has normalised for 2014 and the data are based on the building permit data of the Population Register Centre, and the data have not been corrected by statistical methods. According to these data, in 2014 building permits were granted for a total of 29.7 million cubic metres, which is 17 per cent less than in 2013. At the same time, building permits were granted for a total of 27,500 dwellings, which is 7.0 per cent more than in the year before. However, the cubic volume covered by permits for residential buildings fell by 3.3 per cent year-on-year. Measured by the cubic volume covered by permits, 11.0 per cent fewer buildings were started and the volume index of newbuilding decreased by 11.0 per cent from the year before.
Volume index of newbuilding 2010=100, trend

Data of the statistics on building and dwelling production
The now published data are based on register data up to 2014. The data for January to April 2015 have still been estimated using the building permit data of 2014. Due to the estimation, not all data were available with the most detailed purpose of use and regional divisions. The data available will be supplemented over coming months and the data now released may still become revised.
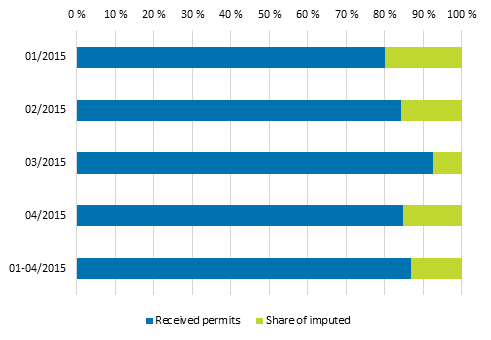
The figure below shows the shares of granted building permits received and imputed by Statistics Finland from January to April by month. The imputation rate in the complete data is around 13 per cent for the period mentioned. The need for imputation in the data has clearly decreased over the past month.
Share of imputed building permits (capacity)

Statistics Finland has been unable to restart the production of the statistics on building and dwelling production in full because the Population Register Centre has not been able to deliver sufficiently extensive building register data concerning the current year to Statistics Finland to be used as the data source of the statistics. The Population Register Centre continues to work in tight cooperation with municipalities in order to be able to start normal statistics production as soon as possible.
Source: Building and dwelling production, Statistics Finland
Inquiries: Mira Kuussaari 029 551 3538, Merja Järvinen 029 551 2458, Heli Suonio 029 551 2481, rakennus.suhdanne@stat.fi
Director in charge: Hannele Orjala
Publication in pdf-format (234.3 kB)
- Tables
-
Tables in databases
Pick the data you need into tables, view the data as graphs, or download the data for your use.
Appendix tables
- Appendix table 1. Building permits, 1000 m3 1) (23.6.2015)
- Appendix table 2. Buildings starts, 1000 m3 1) (23.6.2015)
- Appendix table 3. Building completions, 1000 m3 1) (23.6.2015)
- Appendix table 4. Dwelling construction by building type, number, building permits and building starts 1) (23.6.2015)
- Appendix table 5. Volume index of newbuilding 2010=100 1) (23.6.2015)
Updated 23.6.2015
Official Statistics of Finland (OSF):
Building and dwelling production [e-publication].
ISSN=1798-9590. April 2015. Helsinki: Statistics Finland [referred: 12.2.2026].
Access method: http://stat.fi/til/ras/2015/04/ras_2015_04_2015-06-23_tie_001_en.html

