1. Households’ financial assets contracted and indebtedness continued in 2011
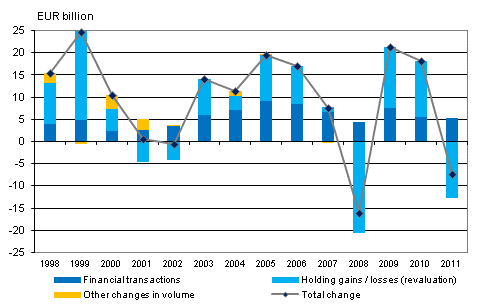
Due to holding losses, households’ financial assets diminished in 2011. As share prices fell, households accumulated holding losses of nearly EUR 13 billion. The holding losses came mostly from quoted shares, insurance technical reserves and mutual fund shares. Households acquired further financial assets to the net amount of EUR 5 billion. Thus, the reduction in households’ financial assets amounted to approximately EUR 7 billion.
Figure 1. Change in financial assets of households 1998-2011

In 2011, households invested most in deposits. Deposits have typically been the most important investment target for households. Last year, households favoured especially term deposits. Households’ net investments in quoted shares also remained positive, but they withdrew their assets from mutual funds.
Overall, households’ financial assets amounted to EUR 218 billion at the end of 2011. Of this amount EUR 80 billion were deposits, EUR 46 billion unquoted shares and equity, EUR 42 billion insurance technical reserves, EUR 21 billion quoted shares and EUR 12 billion mutual fund shares. The value of other financial assets held by households was EUR 17 billion. Households’ shares in housing companies are not recorded in financial accounts as their financial assets.
Households’ debts continued to grow at a steady pace. Their loan debt increased by EUR 6 billion during the year, reaching EUR 117 billion at the end of the year. Indebtedness rate, i.e. proportion of loans relative to disposable income, rose to 115.6 per cent from the previous year's 113.2 per cent.
In consequence of the contraction of households’ financial assets and the growth of their debts, households’ net financial assets, i.e. difference between financial assets and liabilities, decreased. During the year, their net financial assets diminished by some EUR 14 billion, corresponding to a reduction of 13 per cent.
1.1. Government sector’s balance sheet position weakened
The government sector’s balance sheet position weakened in 2011. At the end of the year, the government sector’s net financial assets amounted to EUR 102 billion, which was EUR 15 billion less than one year earlier. Central government’s net financial assets decreased by EUR 13 billion and those of employment pension schemes by EUR 2 billion. Local government’s net financial assets remained on level with the previous year.
The weakening of the central government’s balance sheet position, which started in 2008, continued and the central government’s net financial assets fell to EUR -34 billion. The fall was due both to indebtedness and to the contraction of financial assets. Gross debt at market prices in the financial accounts of the central government increased by EUR 8 billion and financial assets decreased by EUR 5 billion. The reduction in the central government’s financial assets was due to holding losses.
Over the year, the net financial assets of employment pension schemes fell from EUR 136 billion to EUR 133 billion. Most of the reduction in the net financial assets of employment pension schemes is explained by fallen market values of the quoted shared held by them. Employment pension schemes’ holding losses totalled EUR 8 billion and their net investments EUR 5 billion in 2011. Employment pension schemes invested the largest amounts of their assets in debt securities and unquoted shares while in the previous year they still favoured mutual fund shares and quoted shares.
1.2. Emissions of quoted shares livened slightly
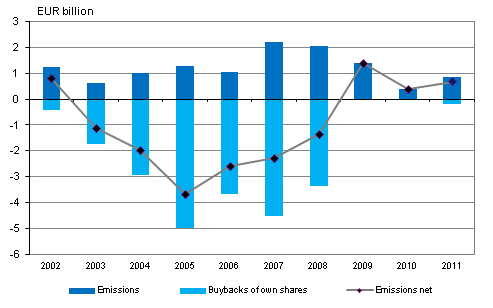
Non-financial corporations acquired financing through issuing new equity on the stock market in 2011. Quoted companies issued new shares to the value of EUR 0.8 billion whereas in the previous year the value of emissions was EUR 0.4 billion. Buybacks of own shares were quite minimal. From 2003 to 2008, non-financial corporations amortized their share debt by buying back more of their own shares than issuing them.Figure 2. Changes in emissions of quoted shares by non-financial corporations 2002-2011, EUR billion

Non-financial corporations also increased their debt financing during the year. Debt financing refers to the total of loan debts and financing in the form of debt securities. Over the year, non-financial corporations' loan debt grew by EUR 3 billion, rising to EUR 169 billion. In addition, non-financial corporations increased their debt by issuing debt securities to the net amount of around EUR 1 billion.
1.3. Domestic mutual funds contracted
Investors withdrew money from domestic mutual funds to the value of some EUR 3 billion. In 2010, more money was still flowing into mutual funds. Especially households, insurance corporations and non-financial corporations withdrew assets from mutual funds. By contrast, net investments from the rest of the world into mutual funds registered in Finland were positive. Over the year, mutual funds shrunk by a total of EUR 7 billion, of which holding losses from investment portfolios accounted for EUR 4 billion. By contrast, new subscriptions exceeded redemptions in money market funds
1.4. Investments to the rest of the world decreased
Foreign bonds and mutual fund shares interested Finnish investors clearly less than in the previous year. Domestic investors withdrew their assets from foreign quoted shares during the year. In 2011, the total value of the net investments of domestic investors in foreign bonds, shares and funds was EUR 8 billion, while in the year before it was still EUR 39 billion.
Some EUR 49 billion of domestic units’ money flowed into foreign deposits and loans. The central bank accounted for the vast majority of the increase in foreign deposits. Loans to the rest of the world were in turn granted by deposits banks.
As in earlier years, foreign investors cut back their holdings in Finnish quoted shares. In all, Finnish quoted shares were sold to domestic investors to the net value of EUR 2 billion last year. At the end of the year, the value of the foreign ownership of quoted shares was EUR 46 billion. The proportion of foreign ownership of the value of Finnish quoted shares fell to 43 per cent. By contrast, Finnish bonds and mutual fund shares interested foreign investors also in 2011.
1.5. Private sector debt under scrutiny
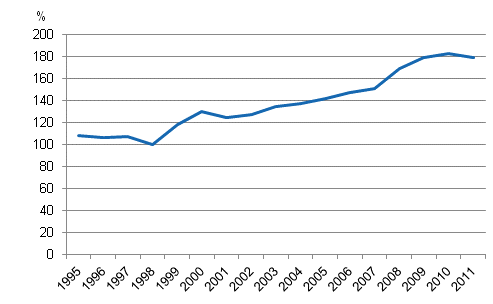
The European Commission has launched a mechanism for the monitoring of macroeconomic imbalance (Macroeconomic Imbalance Procedure), which is based on ten indicators. The indicators have been defined thresholds the passing of which may be a sign of macroeconomic imbalance. One of the indicators is private sector debt as percentage of GDP. Private sector debt comprises the loan debts and debts in the form of debt securities of non-financial corporations, households and non-profit institutions serving households.Figure 3. Private sector debt as percentage of GDP

In 2011, the percentage of private sector debt of GDP fell by four percentage points to 179 per cent. The euro amount of the private sector debt grew but its percentage of GDP fell as GDP went up. Nevertheless, the indicator exceeds the threshold set by the European Commission, which is 160 per cent. A percentage below the threshold was last achieved in 2007.
Source: Financial Accounts, Statistics Finland
Inquiries: Saara Roine 09 1734 3325, rahoitus.tilinpito@stat.fi
Director in charge: Ari Tyrkkö
Updated 12.7.2012
Official Statistics of Finland (OSF):
Financial accounts [e-publication].
ISSN=1458-8145. 2011,
1. Households’ financial assets contracted and indebtedness continued in 2011
. Helsinki: Statistics Finland [referred: 17.2.2026].
Access method: http://stat.fi/til/rtp/2011/rtp_2011_2012-07-12_kat_001_en.html

