Published: 18 January 2013
Households’ indebtedness ratio continued to rise in the third quarter of 2012
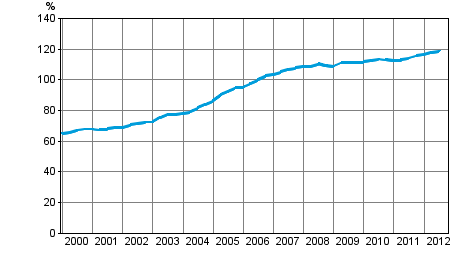
Households’ indebtedness ratio rose to 118.8 per cent in the third quarter of 2012. Households' debts were hiked up by continued escalation of borrowing. Households' net financial assets, i.e. difference between their financial assets and liabilities, made an upturn, which is mainly explained by rising stock market prices that increased the value of quoted shares and mutual fund shares. These data derive from Statistics Finland’s financial accounts statistics.
Households' indebtedness ratio

Households' indebtedness, which accelerated in the previous quarter, slowed down slightly in the third quarter of 2012. Households' debts grew by 1.4 per cent during the period, pushing the stock of debts to EUR 131.7 billion. Households' indebtedness ratio is calculated as the ratio of their loan debts at the end of a quarter to their total disposable income during the preceding four quarters.
Households' investment behaviour was relatively moderate during the quarter. Even though the net amount of investments in shares and mutual fund shares was very small, the upturn in stock market prices was visible as an increase in the value of assets held by households. The holding gains from shares alone held by households amounted to EUR 1.4 billion. The deposits that had grown by EUR 1.5 billion in the previous quarter remained almost unchanged at EUR 81.0 billion, which represents 36 per cent of households’ total financial assets.
During the third quarter of 2012, households' financial assets grew by 1.9 per cent amounting to EUR 225.2 billion at the end of the period. As debts only increased by 1.4 per cent, the net financial assets started to grow by 2.7 per cent. Households' net financial assets stood at EUR 93.5 billion at the end of the third quarter of 2012.
Corporations’ net financial assets that had improved in the second quarter of 2012 remained in practice unchanged in the third quarter. At the end of September 2012, non-financial corporations had EUR 187.3 billion more debts than financial assets. Non-financial corporations' debt financing grew by one per cent to EUR 215.4 billion. Debt financing refers to the total of loan debts and financing in the form of debt securities.
Source: Financial accounts, Statistics Finland
Inquiries: Martti Pykäri 09 1734 3382, rahoitus.tilinpito@stat.fi
Director in charge: Leena Storgårds
Publication in pdf-format (264.6 kB)
- Tables
-
Tables in databases
Pick the data you need into tables, view the data as graphs, or download the data for your use.
Appendix tables
- Figures
Updated 18.1.2013
Official Statistics of Finland (OSF):
Financial accounts [e-publication].
ISSN=1458-8145. 3rd quarter 2012. Helsinki: Statistics Finland [referred: 23.2.2026].
Access method: http://stat.fi/til/rtp/2012/03/rtp_2012_03_2013-01-18_tie_001_en.html

