Published: 27 September 2019
Households’ net assets grew by EUR 21 billion in 2018
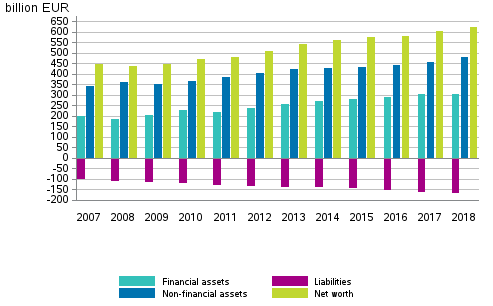
Households’ financial assets amounted to EUR 304 billion and other assets to EUR 482 billion at the end of 2018. Financial assets increased by EUR 1.5 billion during the year and other assets by EUR 26 billion. The most important items in other assets, that is, non-financial assets, are residential buildings and land. Households’ liabilities also grew, in total by EUR six billion, so the level of liabilities rose to EUR 164 billion. When liabilities are deducted from financial assets and other assets, households’ net assets amount to EUR 622 billion. Compared with the year before, households’ net assets grew by EUR 21 billion. These data appear from Statistics Finland's financial accounts statistics.
Households’ financial assets and liabilities, non-financial assets and net worth 2007–2018, EUR billion

Households’ net assets have grown for ten years in a row
Households’ net assets have grown continuously after the drop in 2008. In 2018, the level of net assets, EUR 622 billion, is EUR 184 billion higher than in 2008. In 2018, EUR 21 billion more net assets were accumulated.
The development has been affected by the growth in both financial assets and non-financial assets. Households’ debt load has also grown every year, but financial and non-financial assets have grown faster than indebtedness.
Deposits still continue as the biggest individual financial investment instrument. Despite low interest rates, the amount of households’ deposits grew by nearly EUR six billion during 2018. At the end of 2018, households’ financial assets amounted to EUR 92 billion in deposits. As in previous years, households withdrew their assets from fixed-term deposits at the same time as transferable deposits increased.
The total value of quoted shares and mutual fund shares held by households was EUR 56 billion. The decrease compared with the end of 2017 amounted to EUR six billion mainly due to holding losses.
Households’ indebtedness ratio rose by 1.5 percentage points
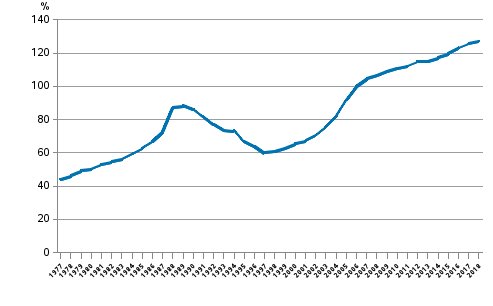
Households' indebtedness ratio has risen annually nearly continuously since 1997. The indebtedness ratio also grew in 2018. Households’ loan debts amounted to EUR 150 billion at the end of 2018. The growth in loan debts raised households' indebtedness ratio by 1.5 percentage points over the year to 127.2 per cent. Households' indebtedness ratio is calculated as the ratio of their loan debts at the end of the year to their total disposable income in the whole year.
Households’ indebtedness ratio 1977 to 2018, loan debt in proportion to disposable income

Source: Financial Accounts, Statistics Finland
Inquiries: Tuomas Koivisto 029 551 3329, Timo Ristimäki 029 551 2324, rahoitus.tilinpito@stat.fi
Director in charge: Ville Vertanen
Publication in pdf-format (387.8 kB)
- Reviews
- Tables
-
Tables in databases
Pick the data you need into tables, view the data as graphs, or download the data for your use.
Appendix tables
- Appendix table 1. Financial assets of households, million EUR (27.9.2019)
- Appendix table 2. Financial liabilities of households, million EUR (27.9.2019)
- Appendix table 3. Households´ net acquistion of financial assets, million EUR (27.9.2019)
- Appendix table 4. Households´ net incurrence of liabilities, million EUR (27.9.2019)
- Appendix table 5. Financial assets of non-financial corporations, million EUR (27.9.2019)
- Appendix table 6. Financial liabilities of non-financial corporations, million EUR (27.9.2019)
- Appendix table 7. Net financial assets by sector, million EUR (27.9.2019)
- Appendix table 8. Net financial transactions by sector, million EUR (27.9.2019)
- Appendix table 9. Statistical discrepancy by sector, million EUR (27.9.2019)
- Appendix table 10. Total assets by sector in 2018, billion EUR (27.9.2019)
- Figures
-
- Appendix figure 1. Financial assets of households (27.9.2019)
- Appendix figure 2. Change in financial assets of households (27.9.2019)
- Appendix figure 3. Households net acquisitions of deposits, quoted shares and mutual funds (27.9.2019)
- Appendix figure 4. Households indebtedness ratio (27.9.2019)
- Appendix figure 5. Private sector debt as percentage of GDP (27.9.2019)
Updated 27.9.2019
Official Statistics of Finland (OSF):
Financial accounts [e-publication].
ISSN=1458-8145. 2018. Helsinki: Statistics Finland [referred: 17.2.2026].
Access method: http://stat.fi/til/rtp/2018/rtp_2018_2019-09-27_tie_001_en.html

