

Published: 21 June 2018
Saving rate of the households sector turned positive in the first quarter of 2018
Households’ saving rate improved in January to March from the previous quarter. The saving rate improved because disposable income grew especially as a result of increased wage income and households’ consumption expenditure increased at a clearly more moderate rate than income. Households' investment rate continued growing. The profit share of the non-financial corporations sector improved compared to the previous quarter as the sector's value added grew more than paid compensation of employees. The investment rate of non-financial corporations grew clearly from the previous quarter. These data derive from Statistics Finland’s quarterly sector accounts.
Key indicators for households and non-financial corporations, seasonally adjusted
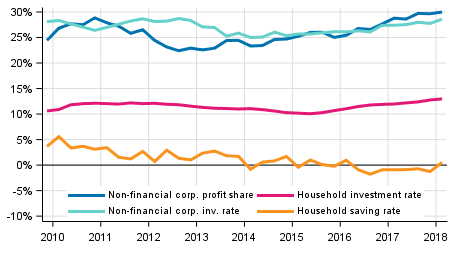
In January to March, households' saving rate grew by 1.8 percentage points to 0.5 per cent. The saving rate refers to the share of households’ savings in disposable income. Households’ investment rate grew slightly and stood at 13 per cent. Most of households' investments were investments in dwellings. Households' adjusted disposable income grew from the corresponding quarter in 2017 by 3.5 per cent adjusted for price changes. Adjusted income is the indicator recommended by the OECD for evaluating the economic well-being of households. Adjusted disposable income is derived by adding individual services produced by the public sector, such as education, health and social services, to the disposable income of households.
In the first quarter of 2018, the profit share of non-financial corporations, or the share of profits in value added, grew to 30 per cent from 29.7 per cent in the previous quarter. The investment rate of non-financial corporations, or the proportion of investments in value added, rose by 0.8 percentage points to 28.6 per cent.
The key figures were calculated from seasonally adjusted time series. Sector accounts are calculated only at current prices. However, a volume indicator describing the development adjusted for price changes is calculated for households' adjusted disposable income in a separate Appendix table. The profit share, saving rate and investment rate are calculated from net figures, which means that consumption of fixed capital is taken into account. Households do not include non-profit institutions serving households.
Source: Sector accounts, Statistics Finland
Inquiries: Pekka Tamminen 029 551 2460, Katri Soinne 029 551 2778, kansantalous.suhdanteet@stat.fi
Director in charge: Ville Vertanen
Publication in pdf-format (402.0 kB)
- Reviews
- Tables
-
Tables in databases
Pick the data you need into tables, view the data as graphs, or download the data for your use.
Appendix tables
- Figures
-
- Appendix figure 1. Volume development of households adjusted disposable income (21.6.2018)
- Appendix figure 2. Households saving rate (21.6.2018)
- Appendix figure 3. Households investment rate (21.6.2018)
- Appendix figure 4. Non - financial corporations profit share (21.6.2018)
- Appendix figure 5. Non - financial corporations investment rate (21.6.2018)
- Revisions in these statistics
-
- Revisions in these statistics (21.6.2018)
Updated 21.6.2018
Official Statistics of Finland (OSF):
Quarterly sector accounts [e-publication].
ISSN=2243-4992. 1st quarter 2018. Helsinki: Statistics Finland [referred: 2.8.2026].
Access method: http://stat.fi/til/sekn/2018/01/sekn_2018_01_2018-06-21_tie_001_en.html