Published: 20 April 2012
Number of marriages contracted decreased
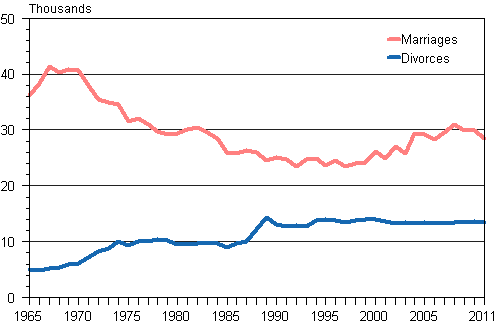
According to Statistics Finland's data on population changes, the number of marriages entered into in 2011 went down clearly from the previous year. A total of 28,408 marriages were entered into, which is 1,544 fewer than in the year before. The marriage rate went down most distinctly in the age groups where most marriages are contracted: among those aged slightly under and slightly over 30.
Number of marriages and divorces 1965–2011

The share of first marriages of all marriages fell slightly, being 76 per cent. The percentage had remained at 77 per cent throughout the first decade of the 2000s.
In 2011, the average age of women who entered into their first marriage was 30.6 years and that of men 32.9 years. Year by year, first marriages are entered into at ever later age. In good four decades, women's average age at the time of entering first marriage has risen by close on eight years and men's by over eight years.
A slightly lower number of divorces was granted in 2011 than one year earlier. Altogether 13,469 marriages ended in divorce, which is 150 fewer than one year previously. At the same time ended the slightly rise in the number of divorces that had started in 2007. However, the decrease is so minor that the divorce rate remained unchanged.
Sixty-nine per cent of the marriages that ended in divorce in 2011 were first marriages for both spouses. In 1990, the corresponding proportion was still 80 per cent.
In 2011, the number of registered same-sex partnerships was 333. Of them, 111 were male couples and 222 female couples. A total of 85 registered same-sex partnerships ended in divorce. Of them, 24 were of male couples and 61 of female couples. In 2010, a total of 322 same-sex partnerships were registered and a total of 64 ended in divorce.
Changes in marital status and mean age of men and women at first marriage in 2002–2011
| Year | ||||||||||
| 2002 | 2003 | 2004 | 2005 | 2006 | 2007 | 2008 | 2009 | 2010 | 2011 | |
| Contracted marriages | 26 969 | 25 815 | 29 342 | 29 283 | 28 236 | 29 497 | 31 014 | 29 836 | 29 952 | 28 408 |
| Divorces | 13 336 | 13 475 | 13 234 | 13 383 | 13 255 | 13 224 | 13 471 | 13 527 | 13 619 | 13 469 |
| Woman's mean age at first marriage | 29,1 | 29,2 | 29,7 | 29,6 | 29,7 | 29,9 | 30,2 | 30,2 | 30,3 | 30,6 |
| Man's mean age at first marriage | 31,3 | 31,5 | 32,1 | 31,8 | 32,1 | 32,3 | 32,5 | 32,5 | 32,6 | 32,9 |
| Registered partnerships | 446 | 190 | 186 | 200 | 191 | 213 | 249 | 246 | 322 | 333 |
| Divorces from registered partnerships | 2 | 6 | 15 | 31 | 30 | 67 | 45 | 53 | 64 | 85 |
Source: Population and Cause of Death Statistics. Statistics Finland
Inquiries: Timo Nikander 09 1734 3250, vaesto.tilasto@stat.fi
Director in charge: Jari Tarkoma
Publication in pdf-format (294.9 kB)
- Tables
-
Tables in databases
Pick the data you need into tables, view the data as graphs, or download the data for your use.
Appendix tables
- Figures
-
- Appendix figure 1. Average age of women by first marriage and first live birth 1982 - 2011 (20.4.2012)
- Appendix figure 2. Marriage rate by age 1990, 2000, 2010 and 2011 (20.4.2012)
- Appendix figure 3. Divorce rate by age 1990, 2000, 2010 and 2011 (20.4.2012)
- Appendix figure 4. Accumulated divorces by the end of 2011 from marriages entered into in different years (20.4.2012)
- Quality descriptions
-
- Quality description, changes in marital status (20.4.2012)
Updated 20.4.2012
Official Statistics of Finland (OSF):
Changes in marital status [e-publication].
ISSN=1797-643X. 2011. Helsinki: Statistics Finland [referred: 11.2.2026].
Access method: http://stat.fi/til/ssaaty/2011/ssaaty_2011_2012-04-20_tie_001_en.html

