Published: 17 April 2014
Number of marriages entered into clearly lower, slightly more divorces
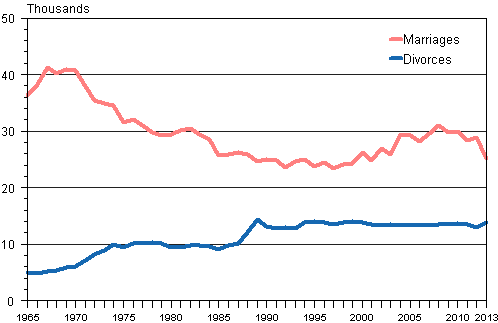
According to Statistics Finland's data on population changes, the number of marriages entered into in 2013 went down steeply from the previous year. A total of 25,119 marriages were entered into, which was 3,759 fewer than in the year before. The decrease in the marriage rate concerned almost without exception all age groups.
Number of marriages and divorces 1965–2012

One reason for the popularity of getting married in the past few years has been the exceptional dates like 08.08.08 (8 August 2008) or 12.12.12 (12 December 2012) that have made couples time their weddings to these dates. For example, in December 2012, altogether 3,460 marriages were entered into, while in December 2013, the number was only 1,894, which was closer to the normal number of marriages in December over the past decade. The decrease in marriages entered into in December alone represented 42 per cent of the decrease in all marriages entered into during 2013.
A majority of the decrease in marriages came from a decline in first marriages. Despite this, the share of first marriages in all marriages remained almost unchanged at around three-quarters. The relative share has remained at the same level throughout the first decade of the 2000s.
In 2013, the prolonged growth in the average age of both women and men at the time of entering into first marriage ended, as women's average age decreased by 0.2 and men's by 0.3 years from 2012. The average age of women entering into their first marriage was 30.6 years and 32.8 years for men.
In 2013, the number of divorces increased while it had decreased in the two previous years. Altogether 13,766 marriages ended in divorce, which is 766 more than one year previously. Viewed by age, the increase in the divorce rate was divided relatively evenly among persons aged under 50.
Even though the divorce rate rose slightly, the likelihood that a first marriage ends in divorce remained at the same level as in the past few years. According to the number of divorces in 2013, first marriages ended in divorce with a probability of 39 per cent.
Sixty-eight per cent of the marriages that ended in divorce in 2013 were first marriages for both spouses. The share decreased by one percentage point from 2012. In 1990, the corresponding percentage was still 80.
In 2013, the number of registered same-sex partnerships was 373. Of them, 126 were male couples and 247 female couples. A total of 101 registered same-sex partnerships ended in divorce. Of them, 29 were of male couples and 72 of female couples. In 2012, altogether 329 same-sex partnerships were registered and 103 same-sex partnerships ended in divorce.
Changes in marital status and mean age of men and women at first marriage in 2004–2013
| Year | ||||||||||
| 2004 | 2005 | 2006 | 2007 | 2008 | 2009 | 2010 | 2011 | 2012 | 2013 | |
| Contracted marriages | 29 342 | 29 283 | 28 236 | 29 497 | 31 014 | 29 836 | 29 952 | 28 408 | 28 878 | 25 119 |
| Divorces | 13 234 | 13 383 | 13 255 | 13 224 | 13 471 | 13 527 | 13 619 | 13 469 | 13 040 | 13 766 |
| Woman's mean age at first marriage | 29,7 | 29,6 | 29,7 | 29,9 | 30,2 | 30,2 | 30,3 | 30,6 | 30,8 | 30,6 |
| Man's mean age at first marriage | 32,1 | 31,8 | 32,1 | 32,3 | 32,5 | 32,5 | 32,6 | 32,9 | 33,1 | 32,8 |
| Registered partnerships | 186 | 200 | 191 | 213 | 249 | 246 | 322 | 333 | 329 | 373 |
| Divorces from registered partnerships | 15 | 31 | 30 | 67 | 45 | 53 | 64 | 85 | 103 | 101 |
Source: Population and Cause of Death Statistics. Statistics Finland
Inquiries: Timo Nikander 09 1734 3250, vaesto.tilasto@stat.fi
Director in charge: Riitta Harala
Publication in pdf-format (290.9 kB)
- Tables
-
Tables in databases
Pick the data you need into tables, view the data as graphs, or download the data for your use.
Appendix tables
- Figures
-
- Appendix figure 1. Average age of women by first marriage and first live birth 1982 - 2013 (17.4.2014)
- Appendix figure 2. Marriage rate by age 1990, 2000, 2012 and 2013 (17.4.2014)
- Appendix figure 3. Divorce rate by age 1990, 2000, 2012 and 2013 (17.4.2014)
- Appendix figure 4. Accumulated divorces by the end 2013 from marriages entered into in different years (17.4.2014)
- Quality descriptions
-
- Quality description, changes in marital status (17.4.2014)
Updated 17.4.2014
Official Statistics of Finland (OSF):
Changes in marital status [e-publication].
ISSN=1797-643X. 2013. Helsinki: Statistics Finland [referred: 11.2.2026].
Access method: http://stat.fi/til/ssaaty/2013/ssaaty_2013_2014-04-17_tie_001_en.html

